NYC Crash Mapper
March 03, 2017
Project Link: NYC Crash Mapper
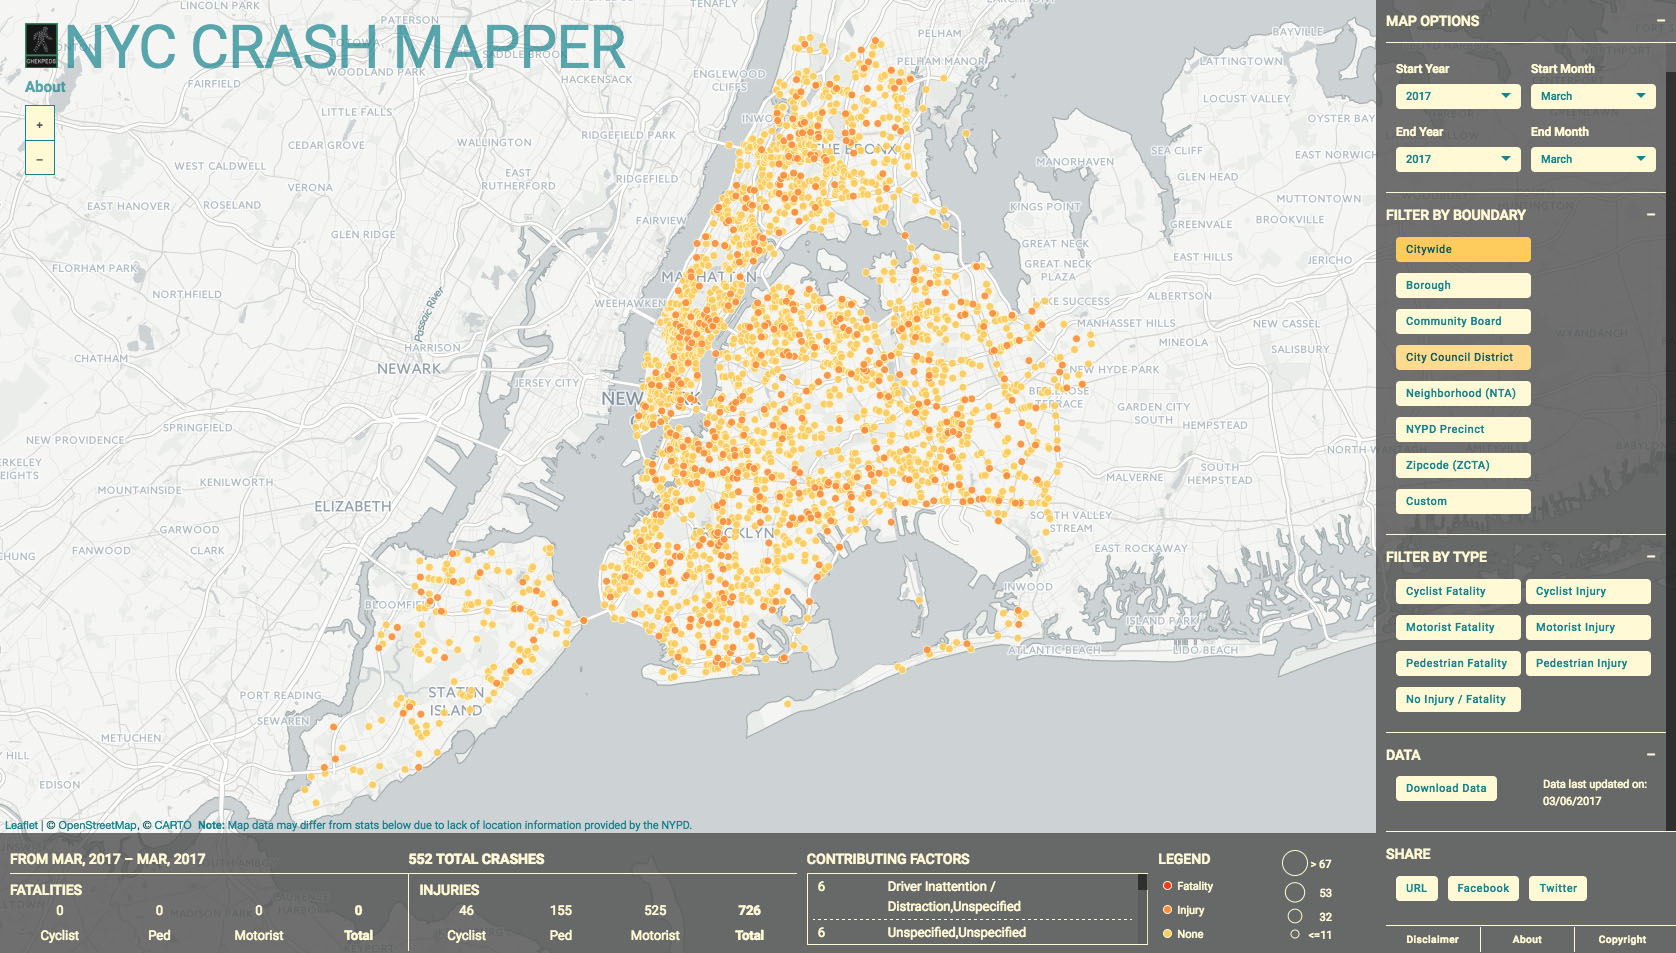
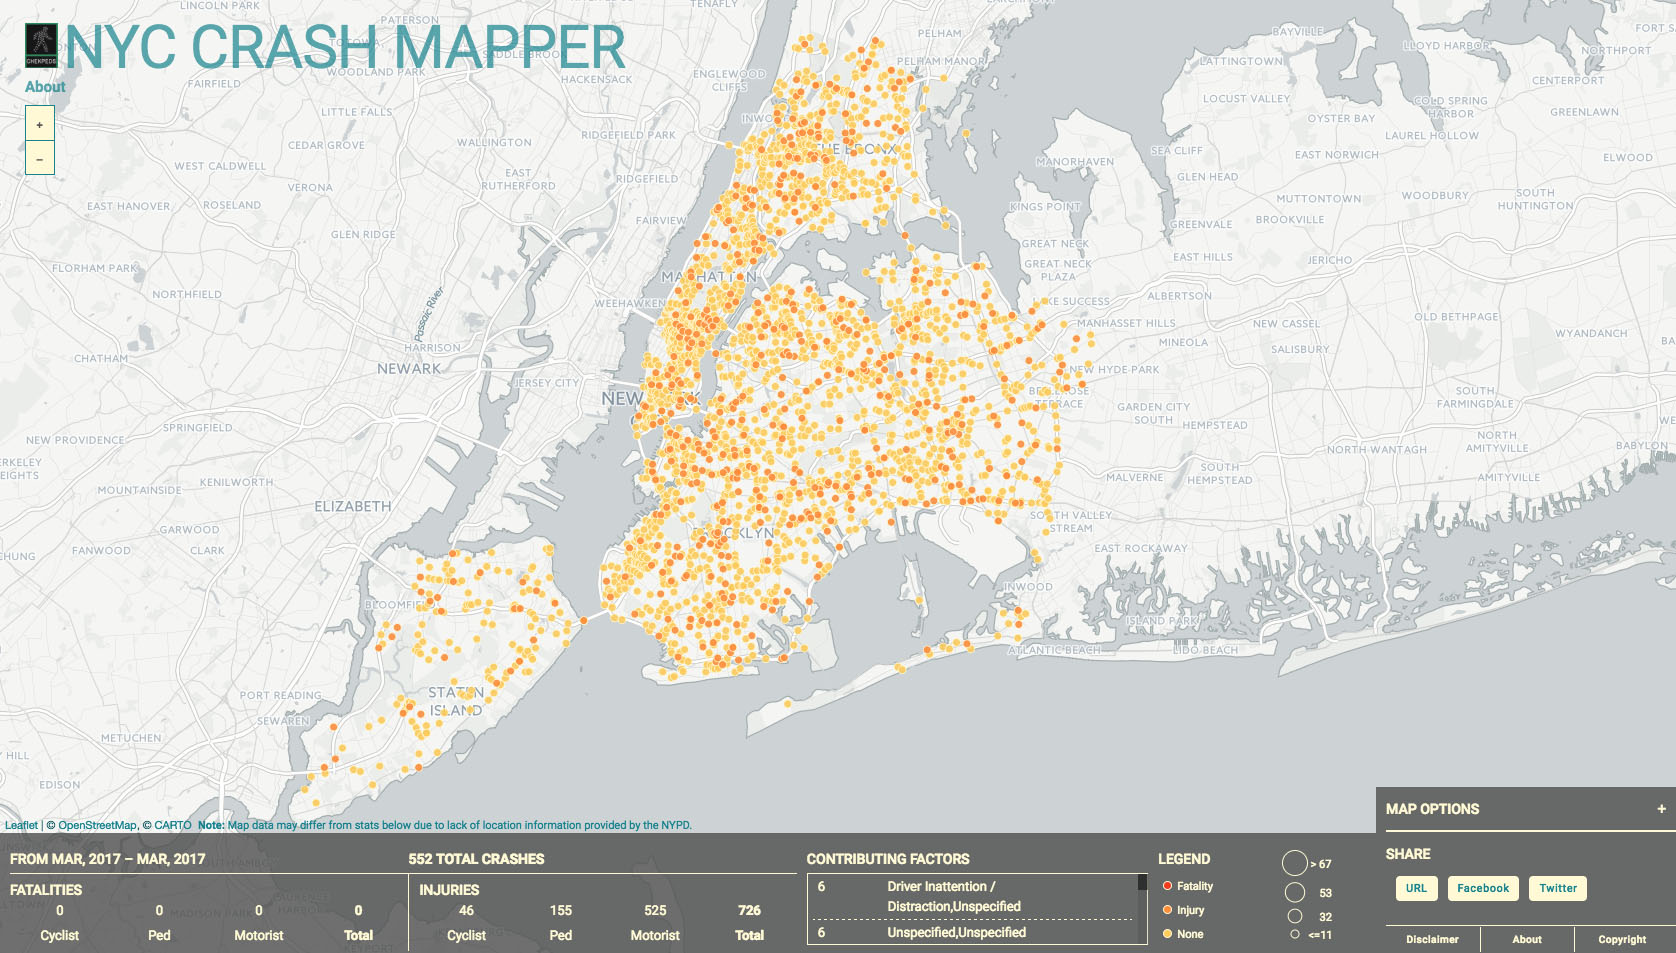
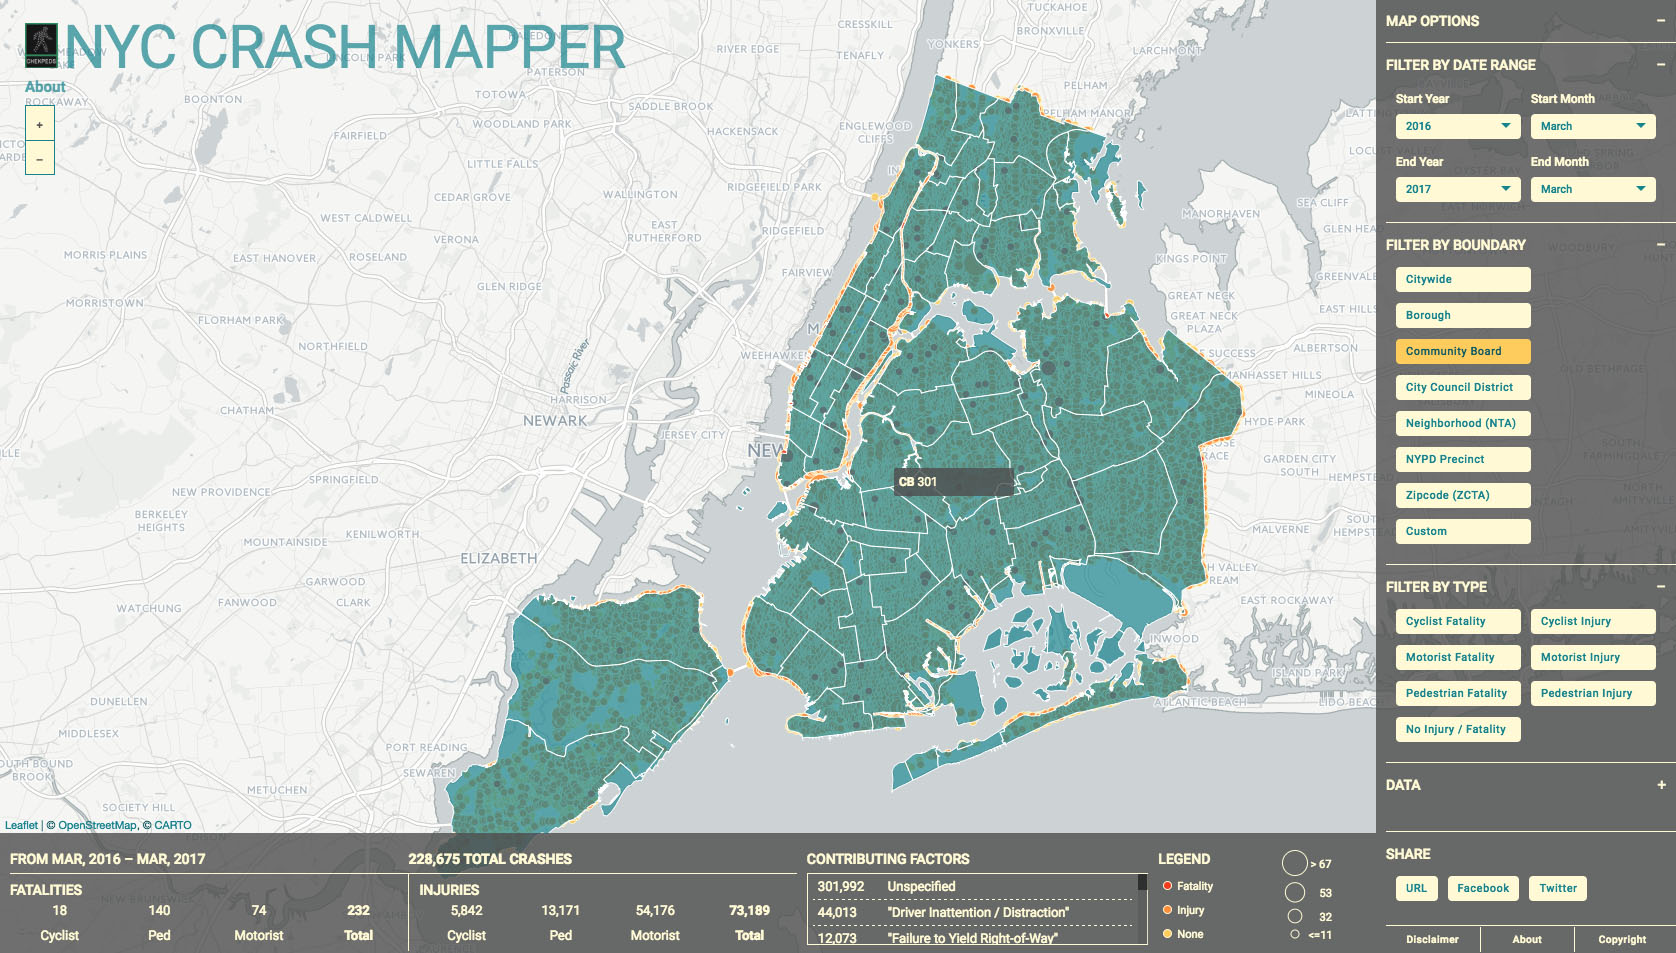
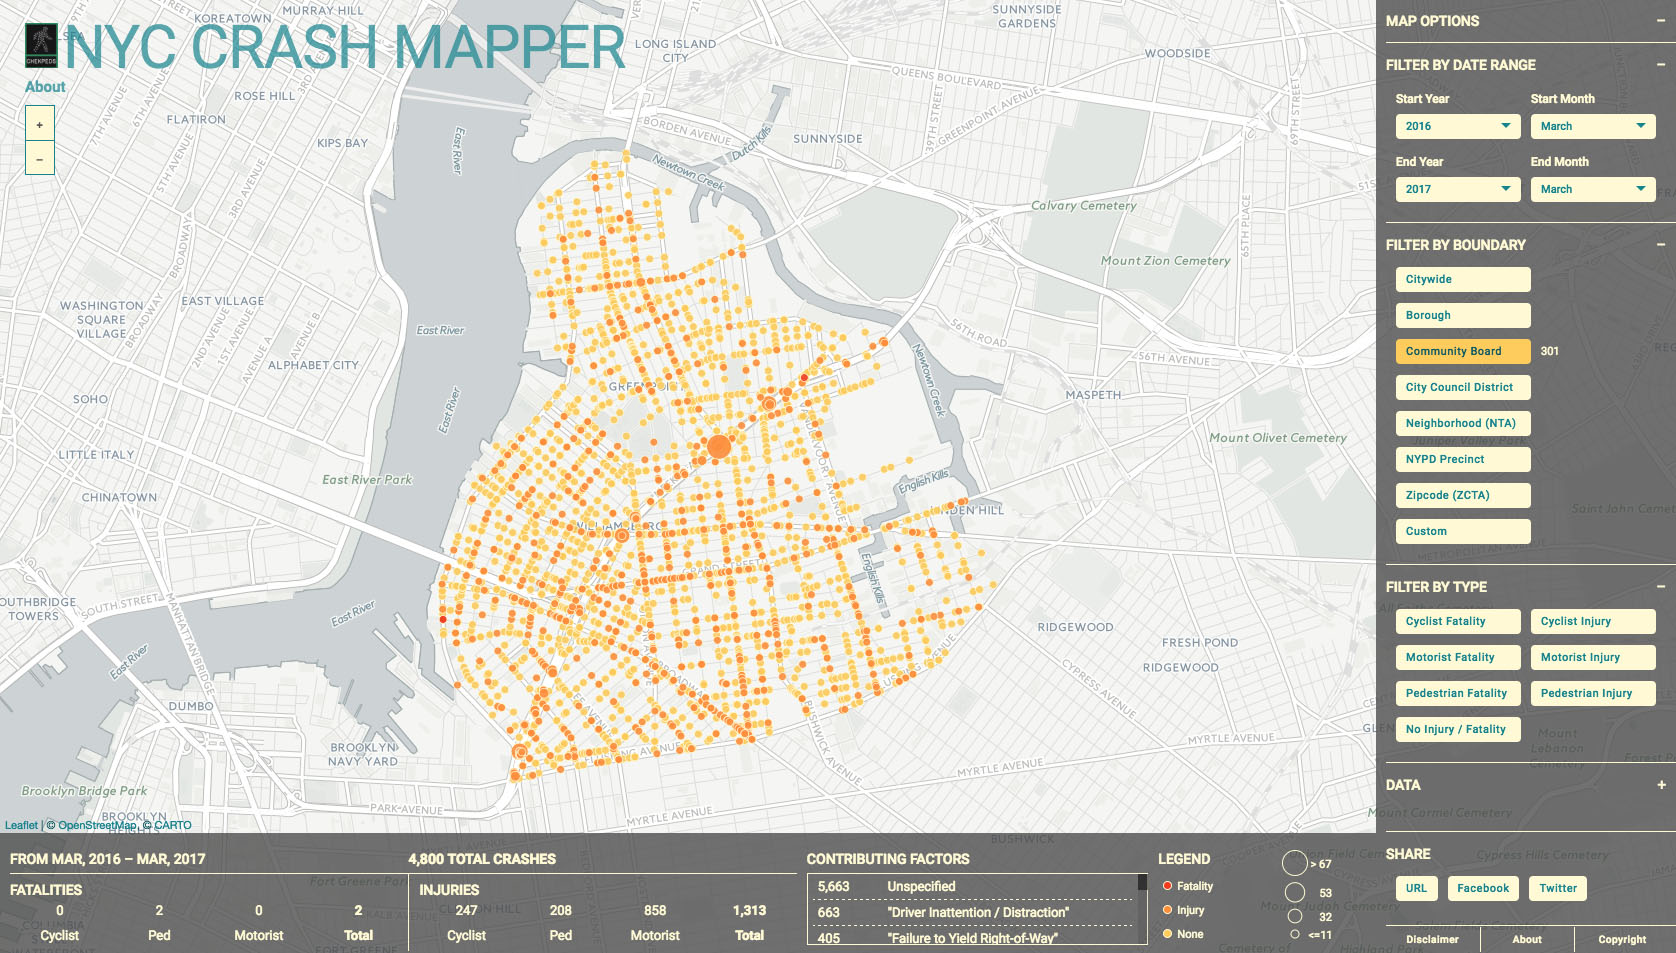
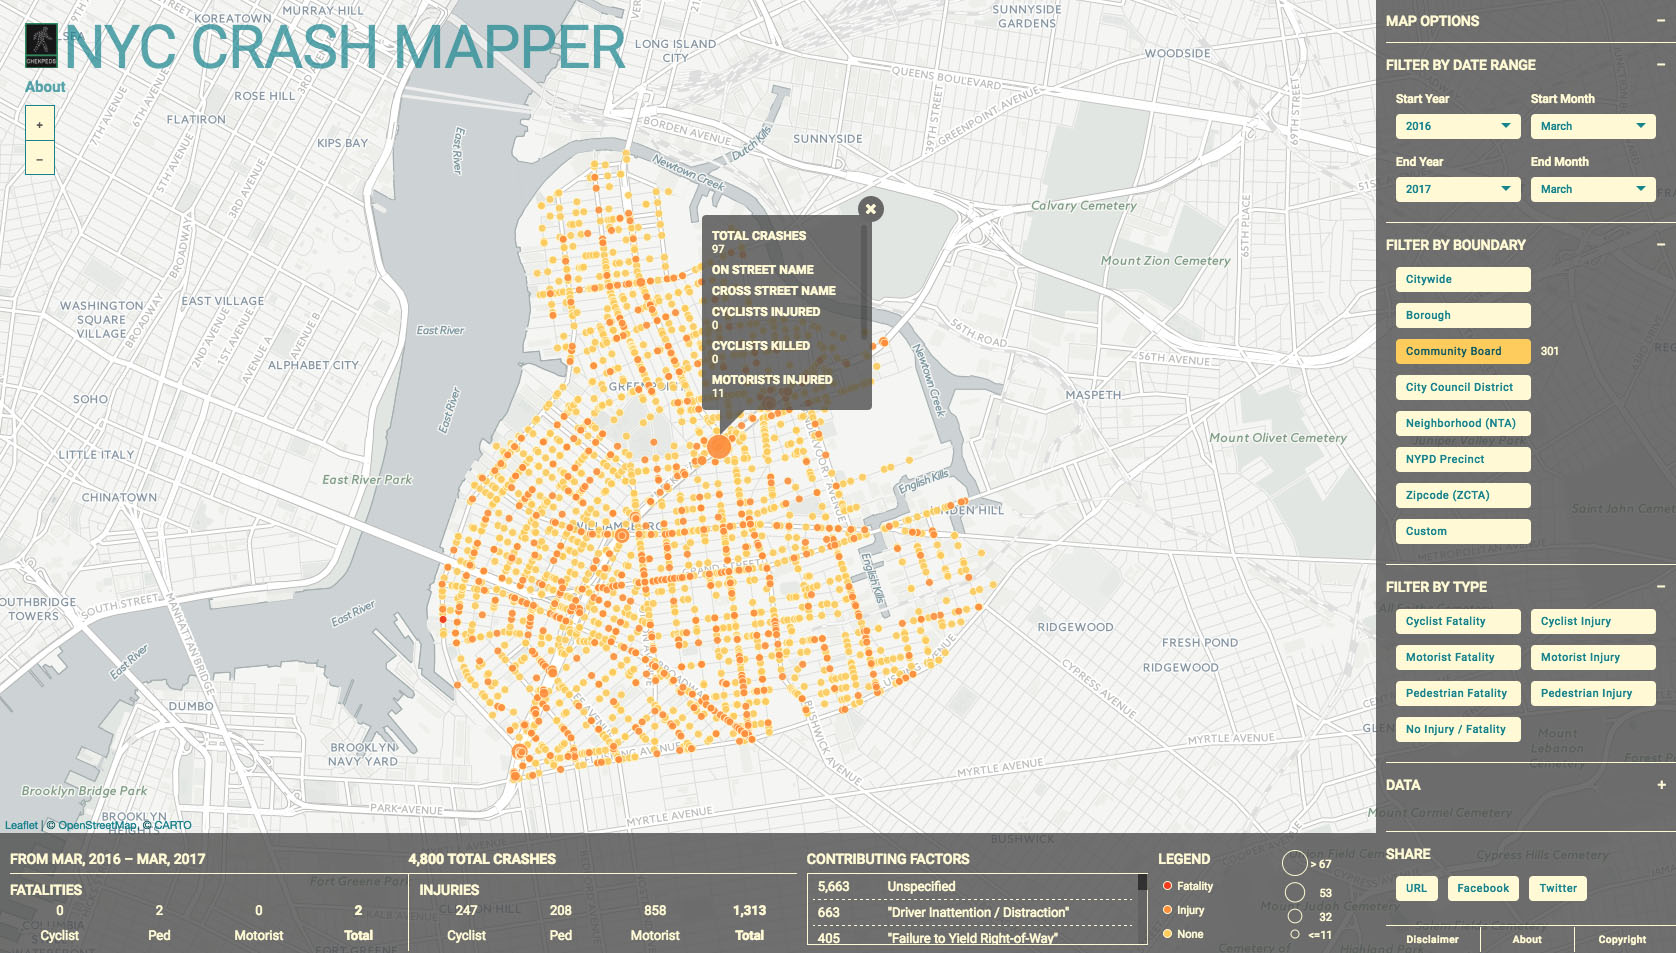
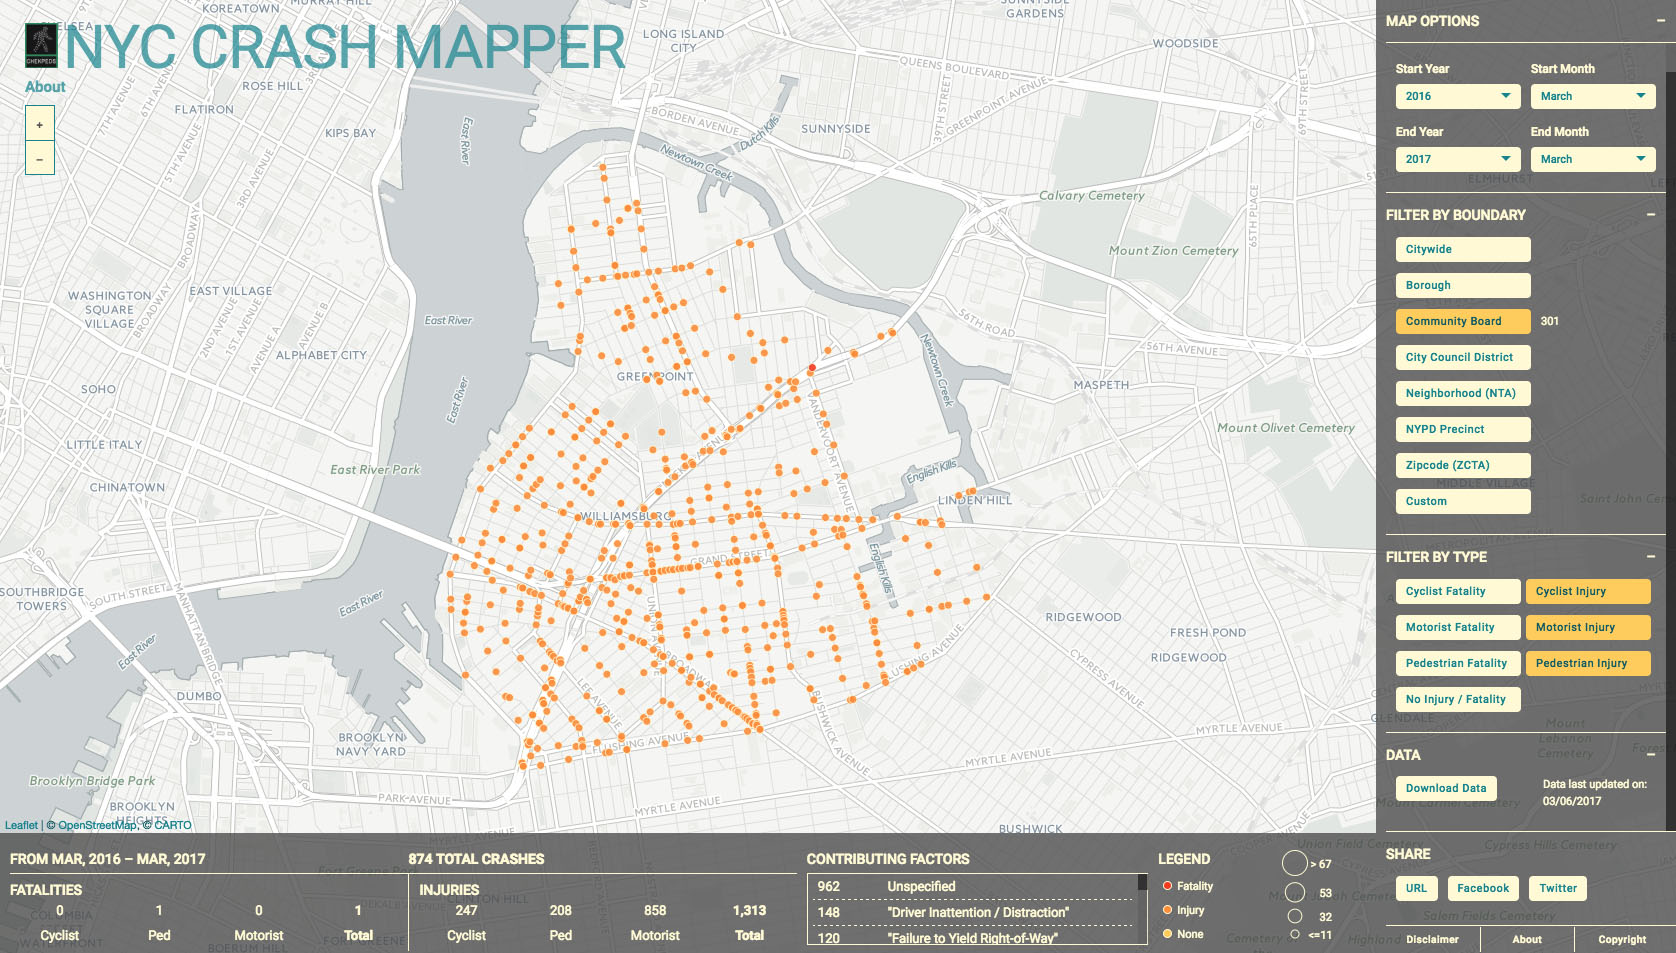
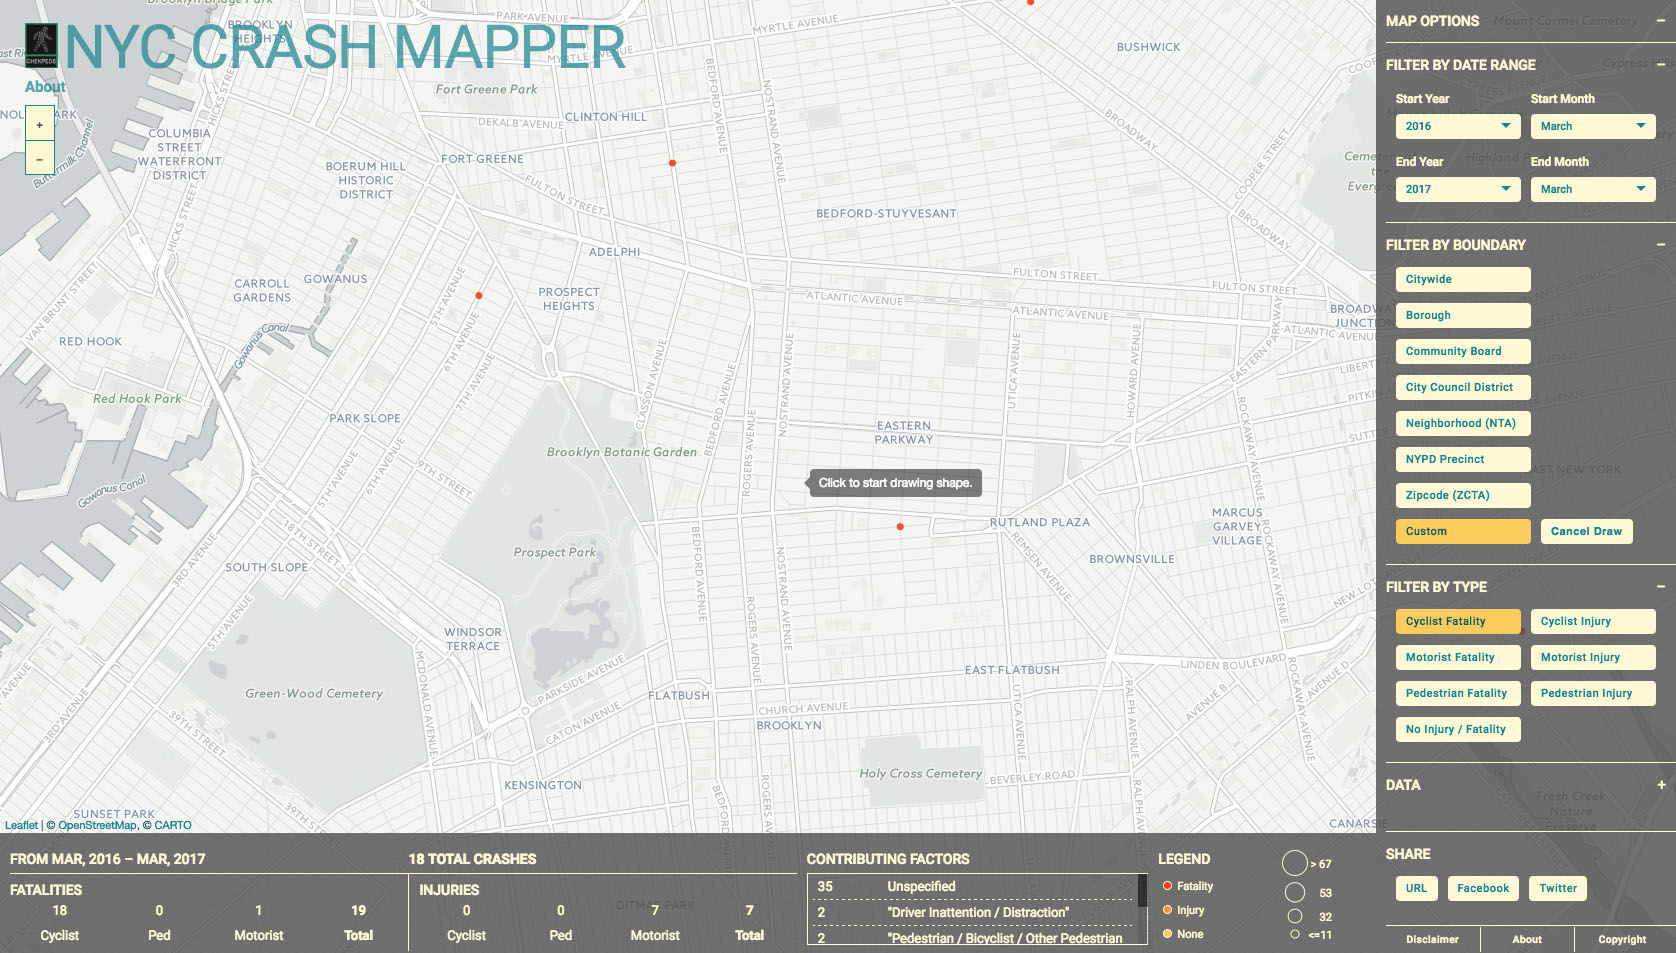
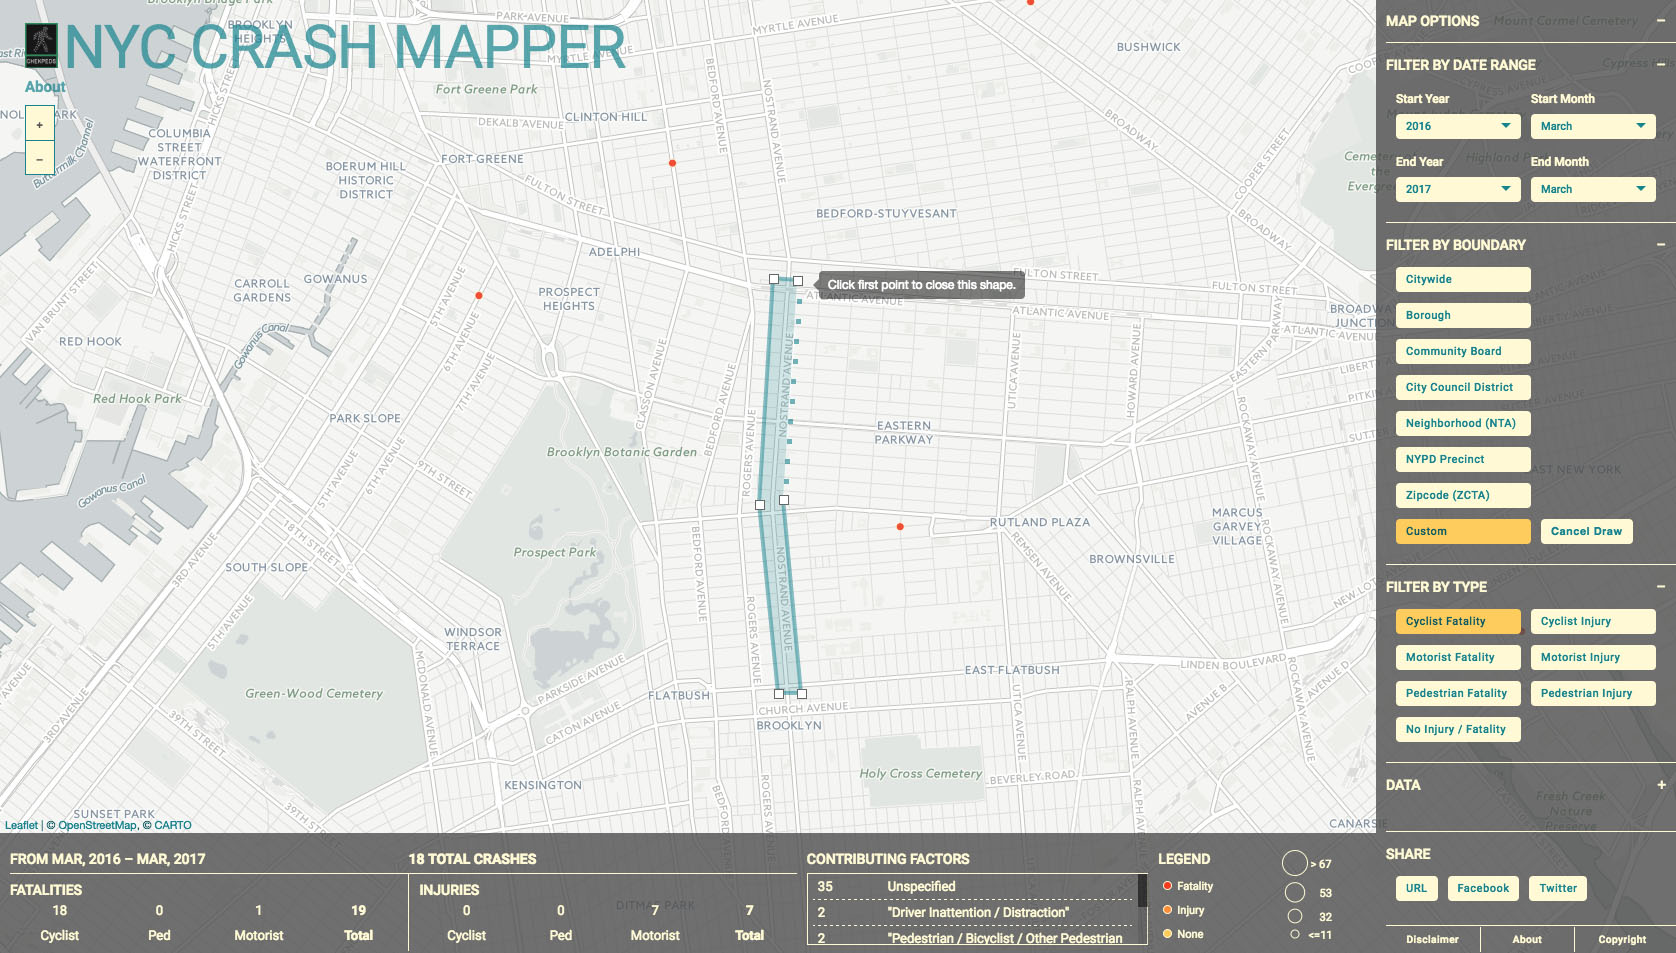
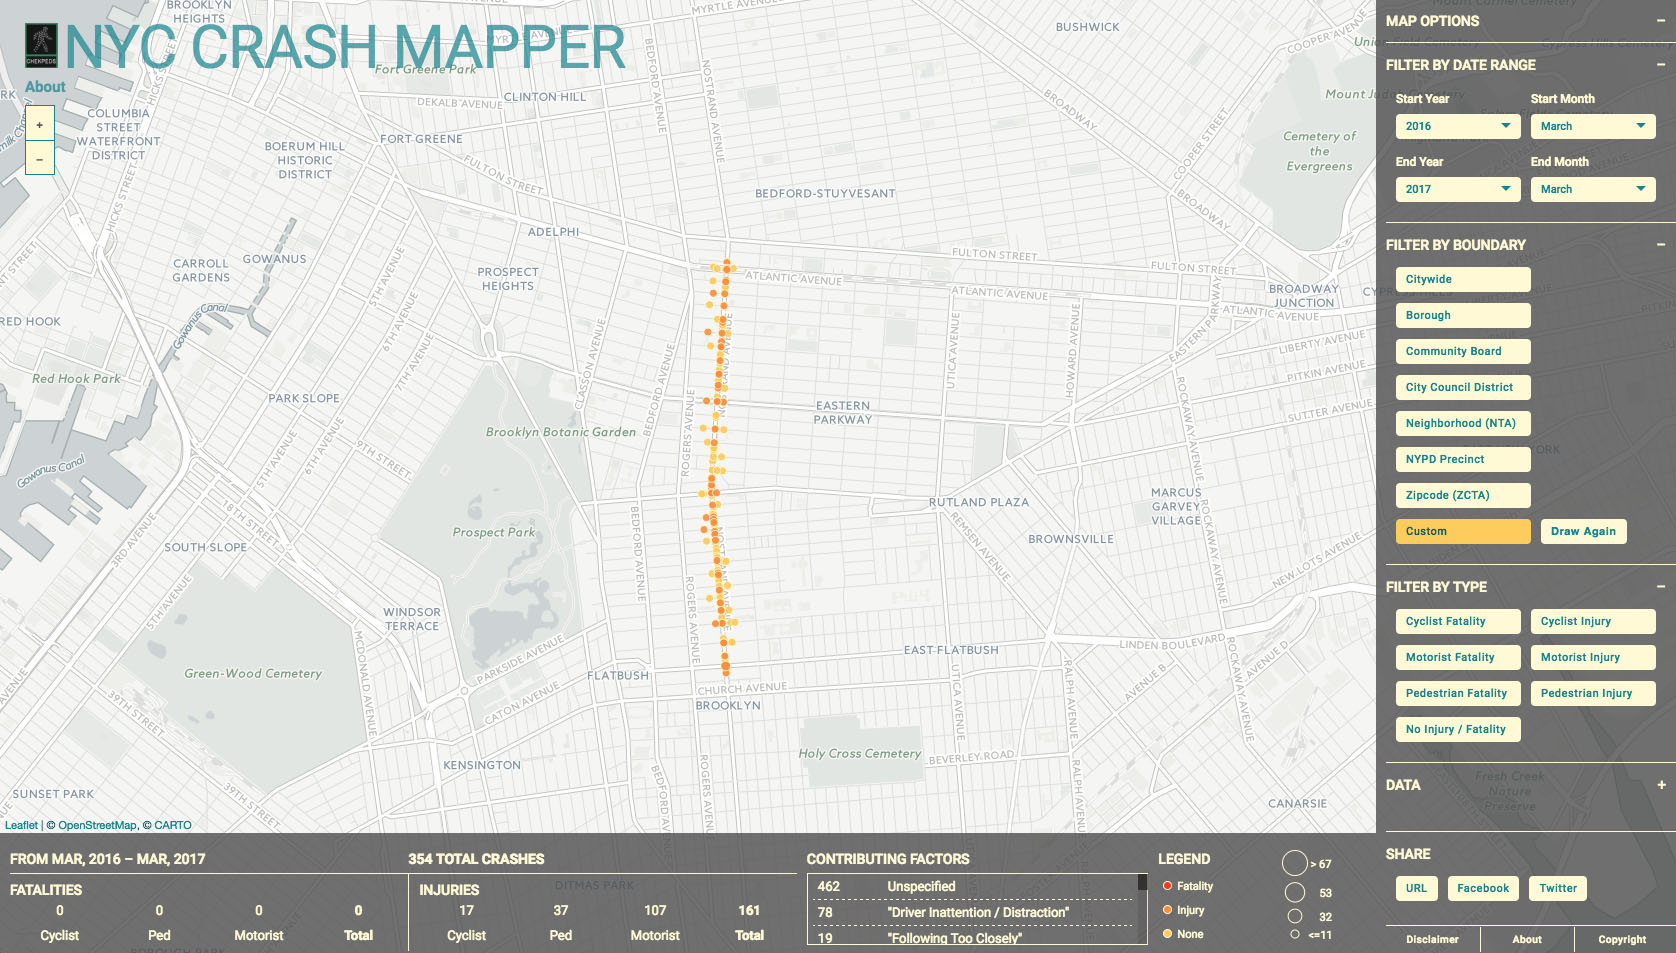
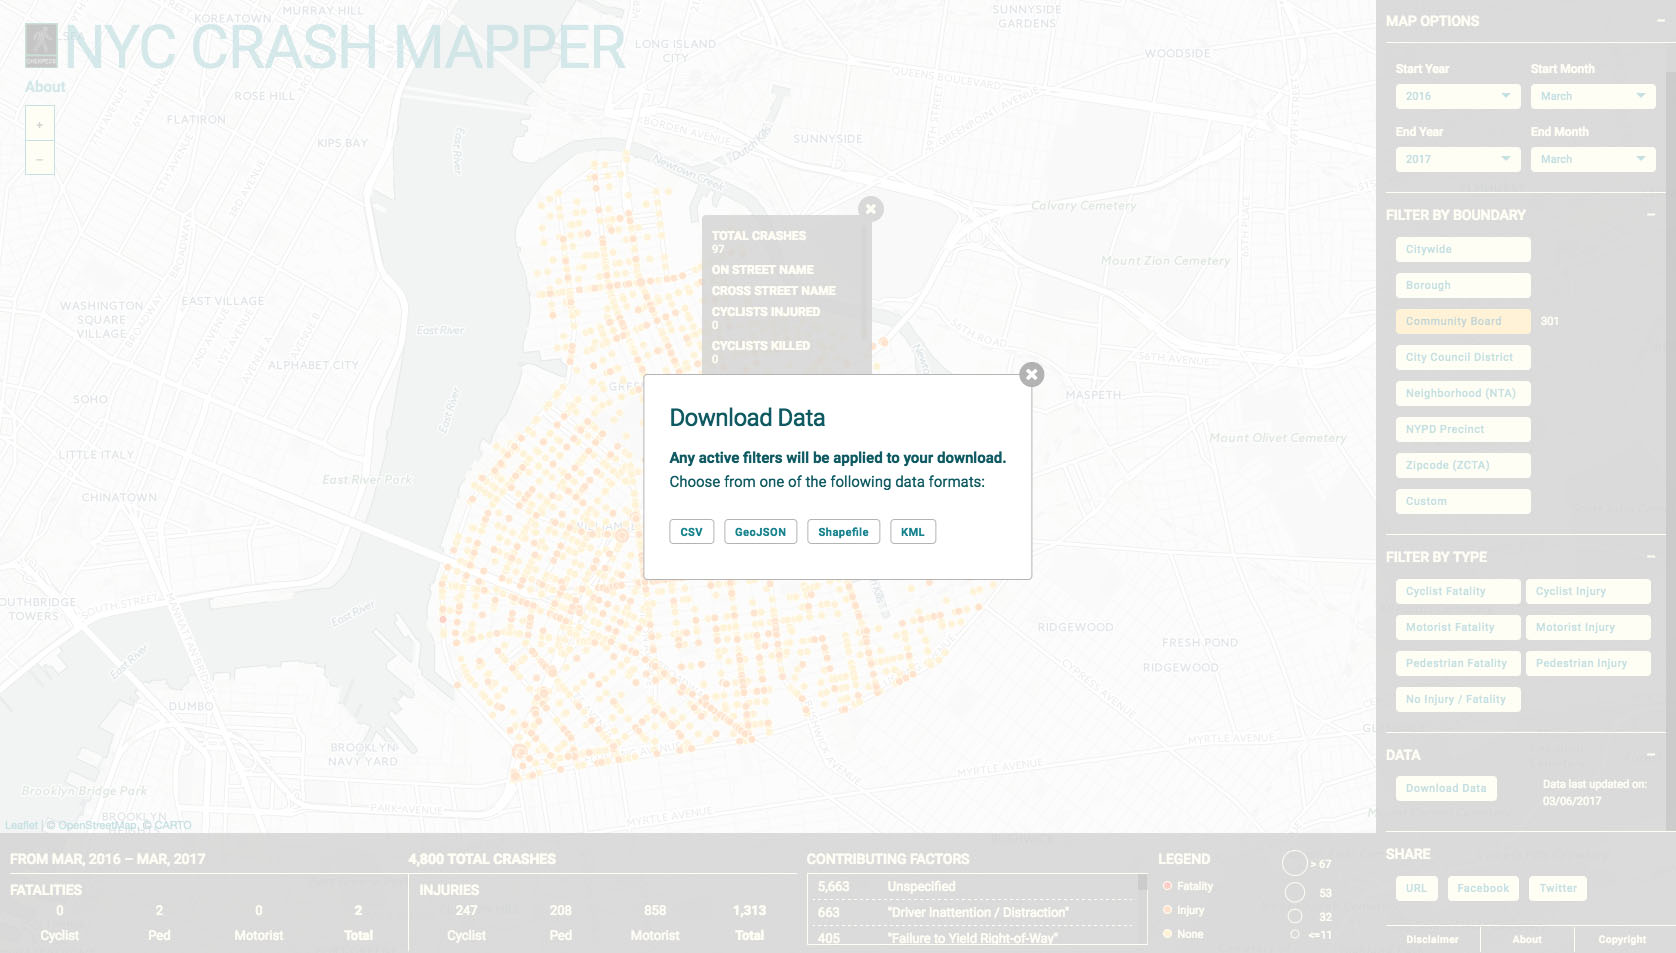
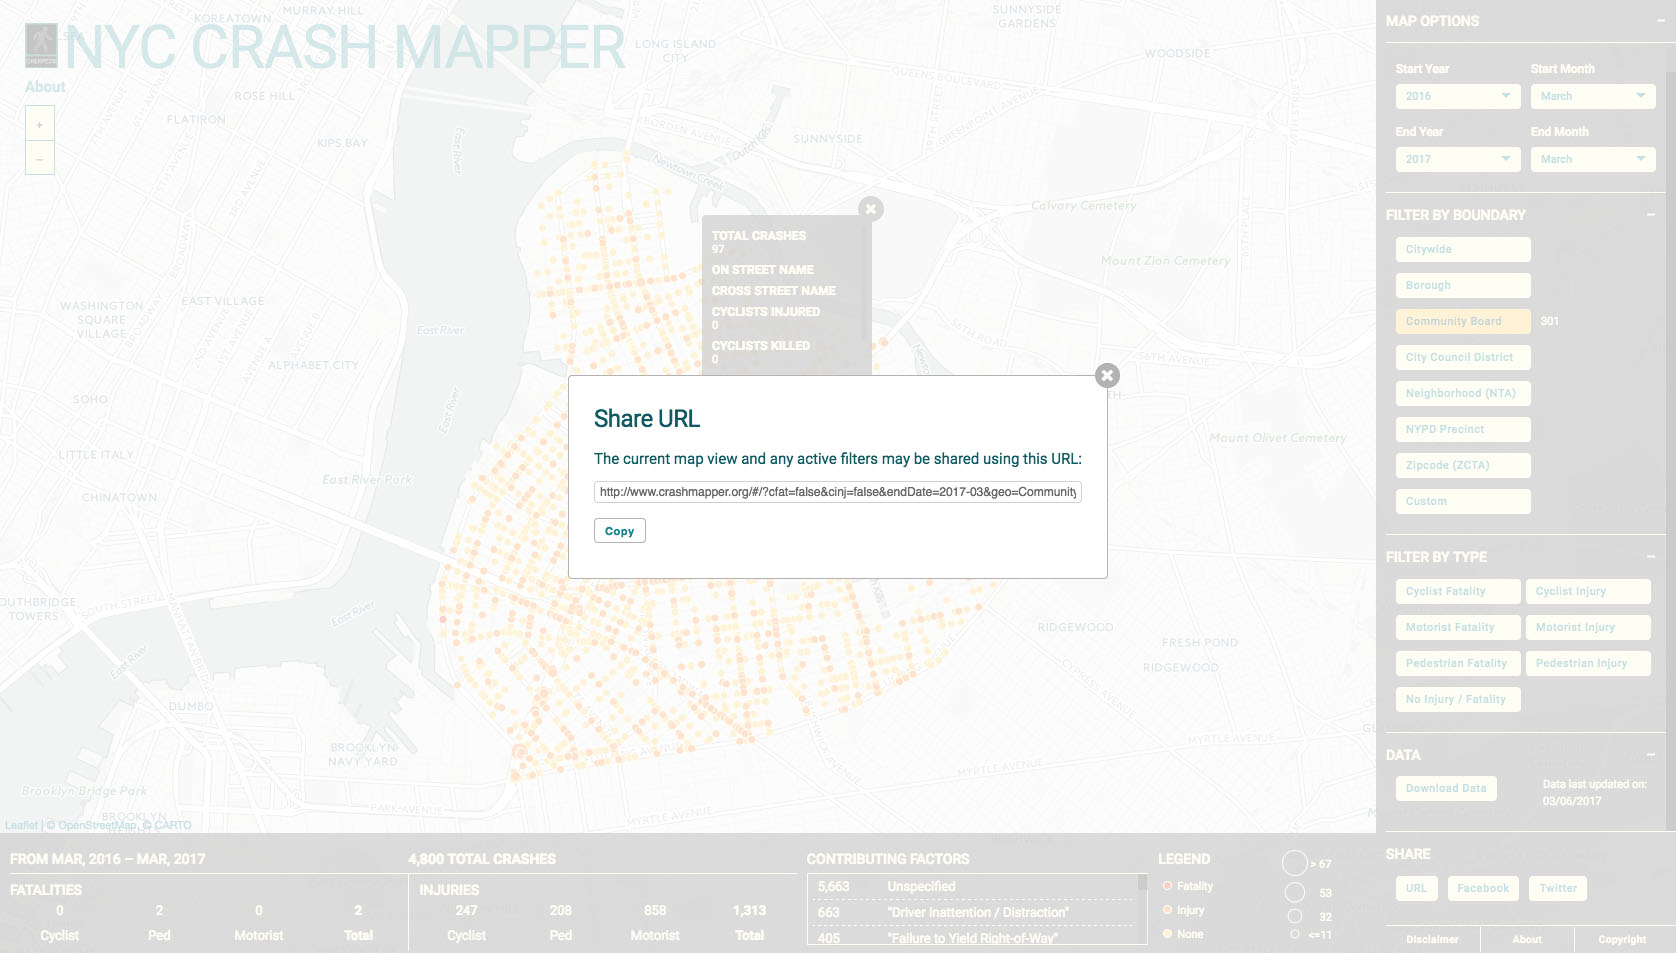
NYC Crash Mapper is a web application that dynamically maps, analyzes, and filters vehicle collision data reported by the NYPD in New York City from 2011 to present. The web app allows a user to select a date range for when crashes occurred, filter the data by crash type (injury or fatality; pedestrian, cyclist, or motorist), filter by administrative boundary, or filter by a custom area using a draw tool. Specific “views” of the data can be shared with other users via a stateful URL which contains any applied filters and map zoom and center. Data from the app may be downloaded in various formats such as CSV, Shapefile, and GeoJSON. New collision data is updated to the app’s database weekly using an ETL script running on a Heroku Scheduler. Chekpeds, a non-profit that advocates for pedestrian safety in Hell’s Kitchen, funded the work on the app through a grant from New York City. In addition to developing the app, I designed the user interface using Adobe Illustrator. NYC Crash Mapper began as a personal project of mine, then was further developed to include interactive chart components during my tenure at GreenInfo Network. NYC Crash Mapper was featured on the infamous NYC Streets Blog. I gave a talk about the app and the challenges of using open data at the NACIS 2017 annual conference.
Technologies Used: - React - Redux - Leaflet - D3 - Javascript ES6 - CARTO - PostgreSQL - PostGIS - Webpack