NYC Crash Mapper 2
November 23, 2017
Project Link: NYC Crash Mapper 2
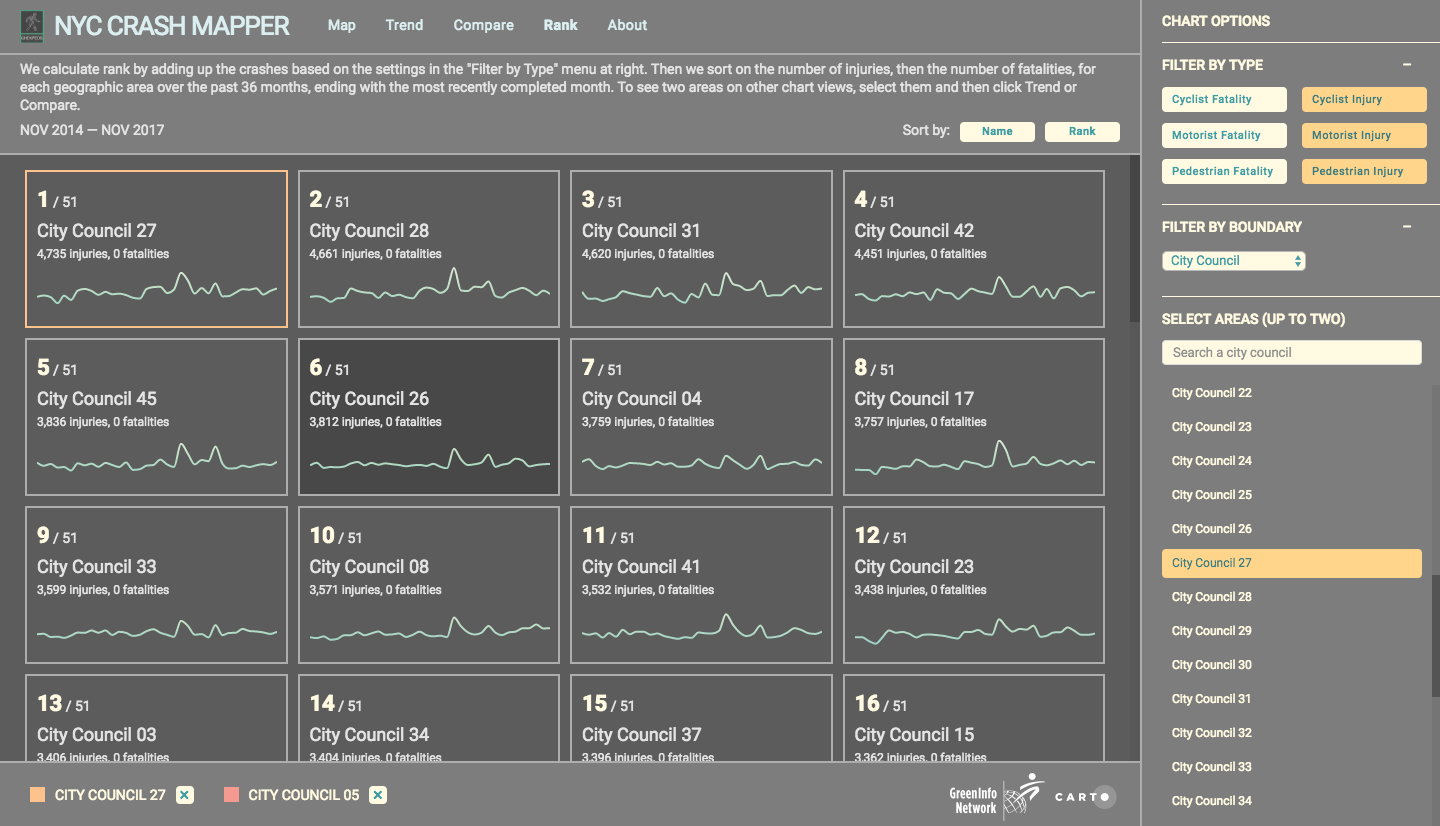
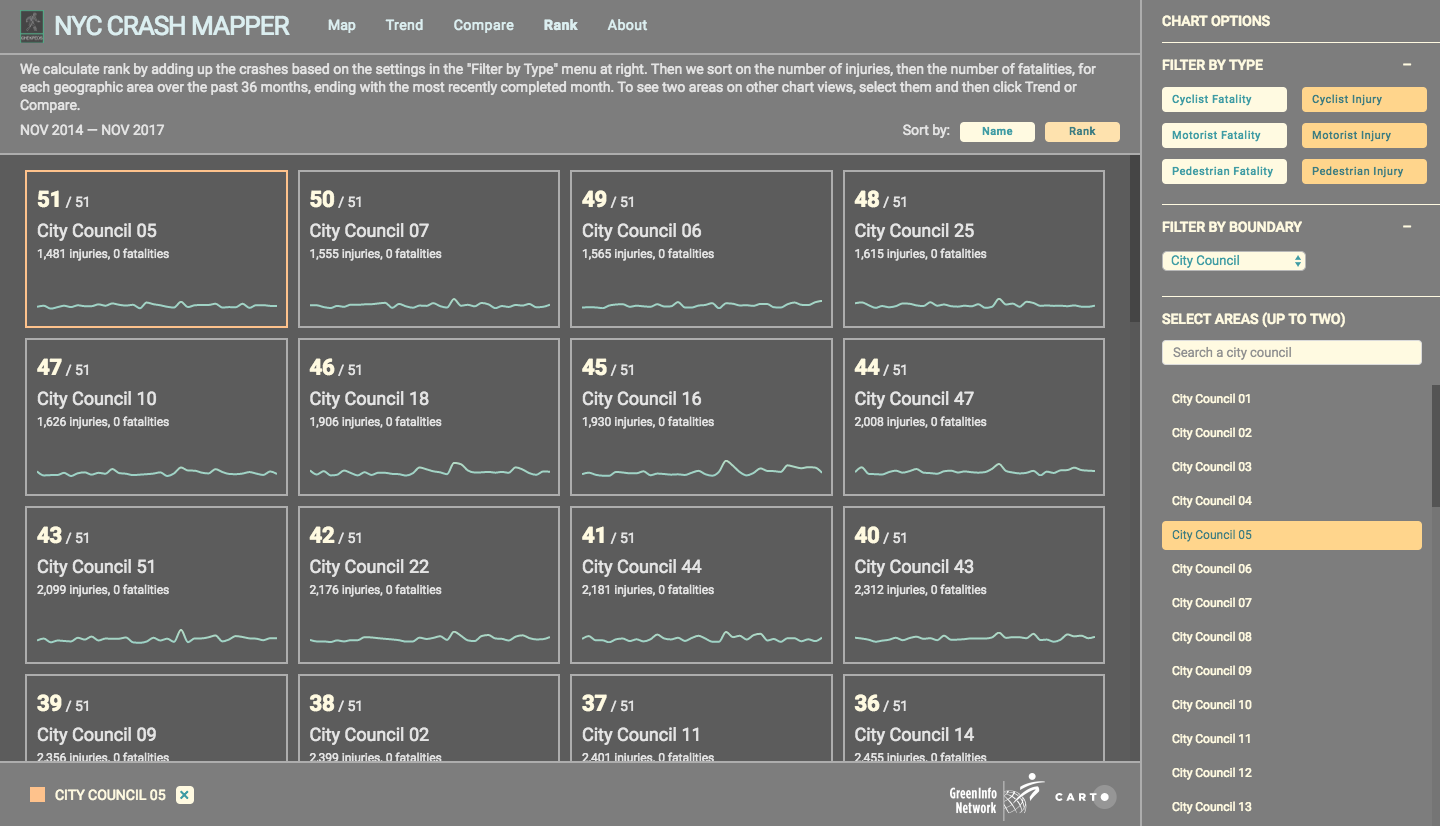
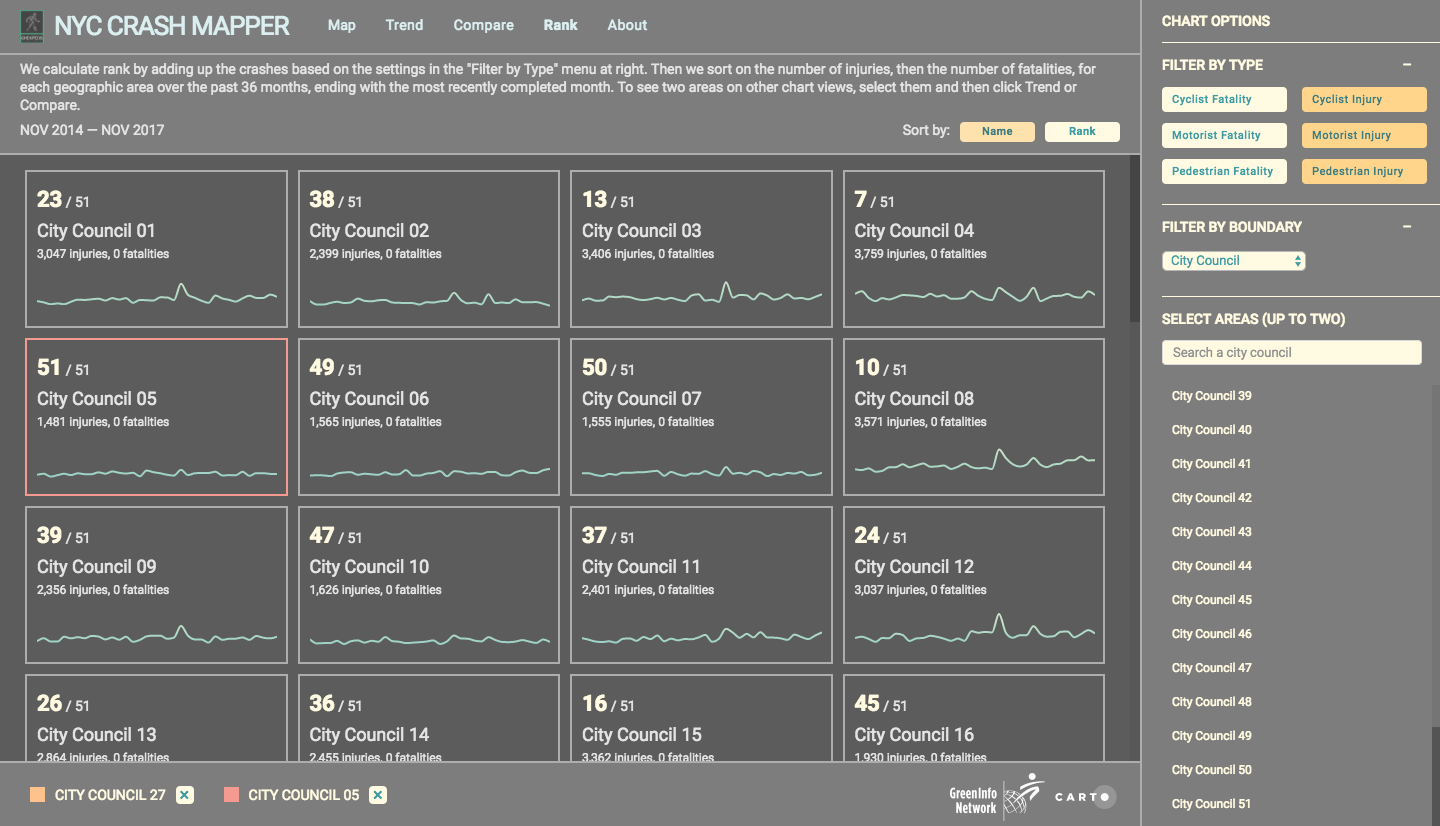
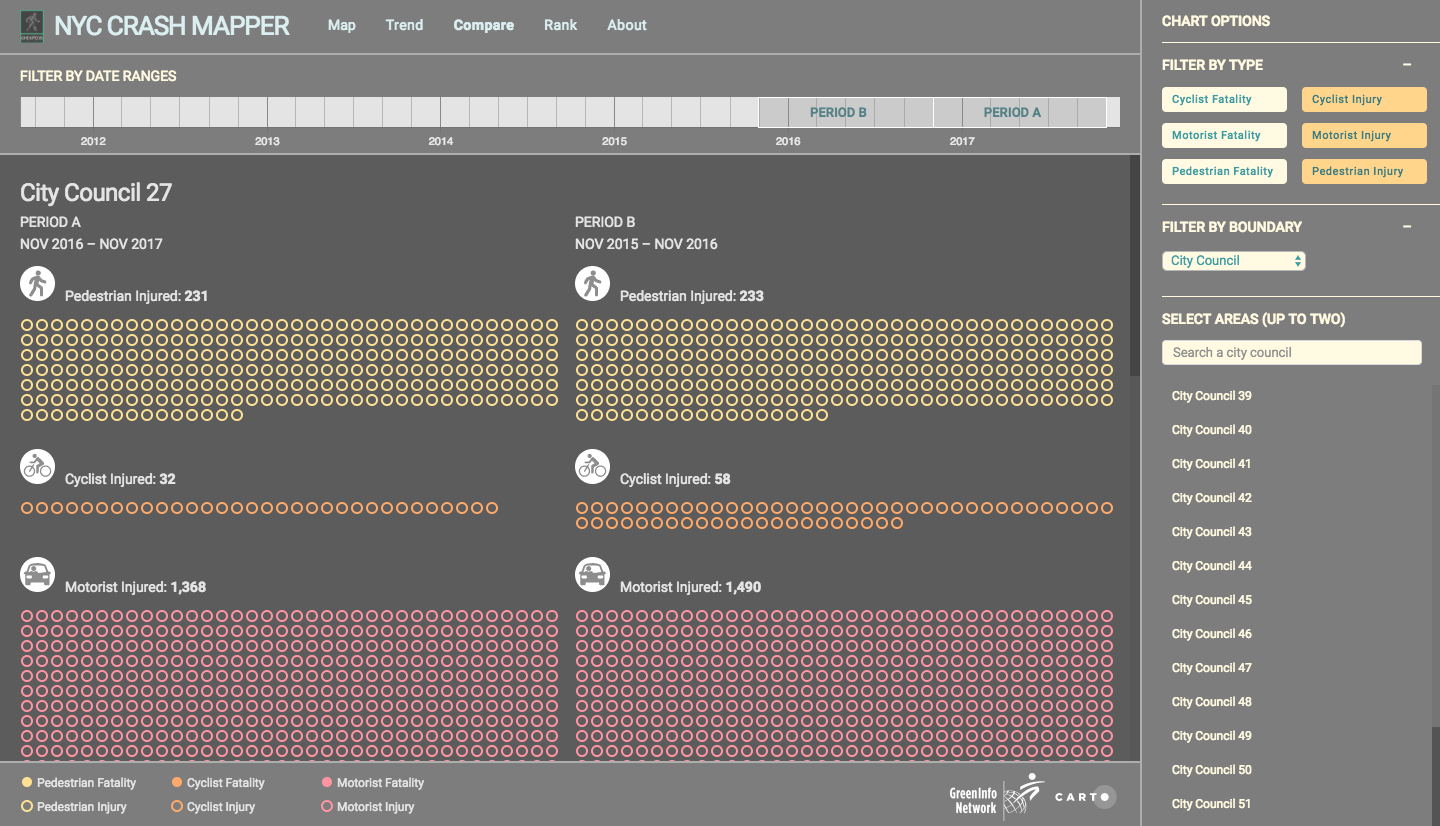
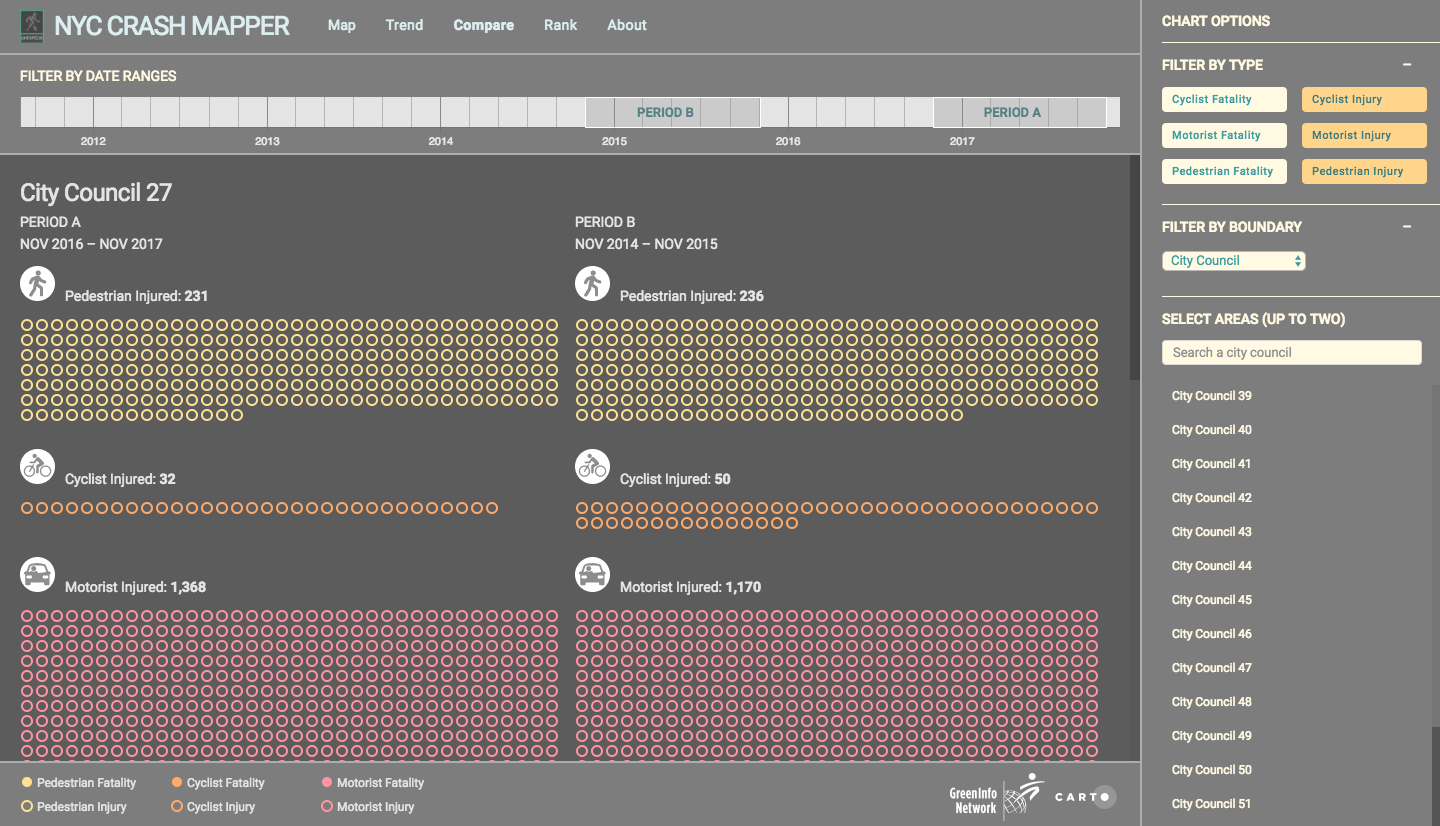
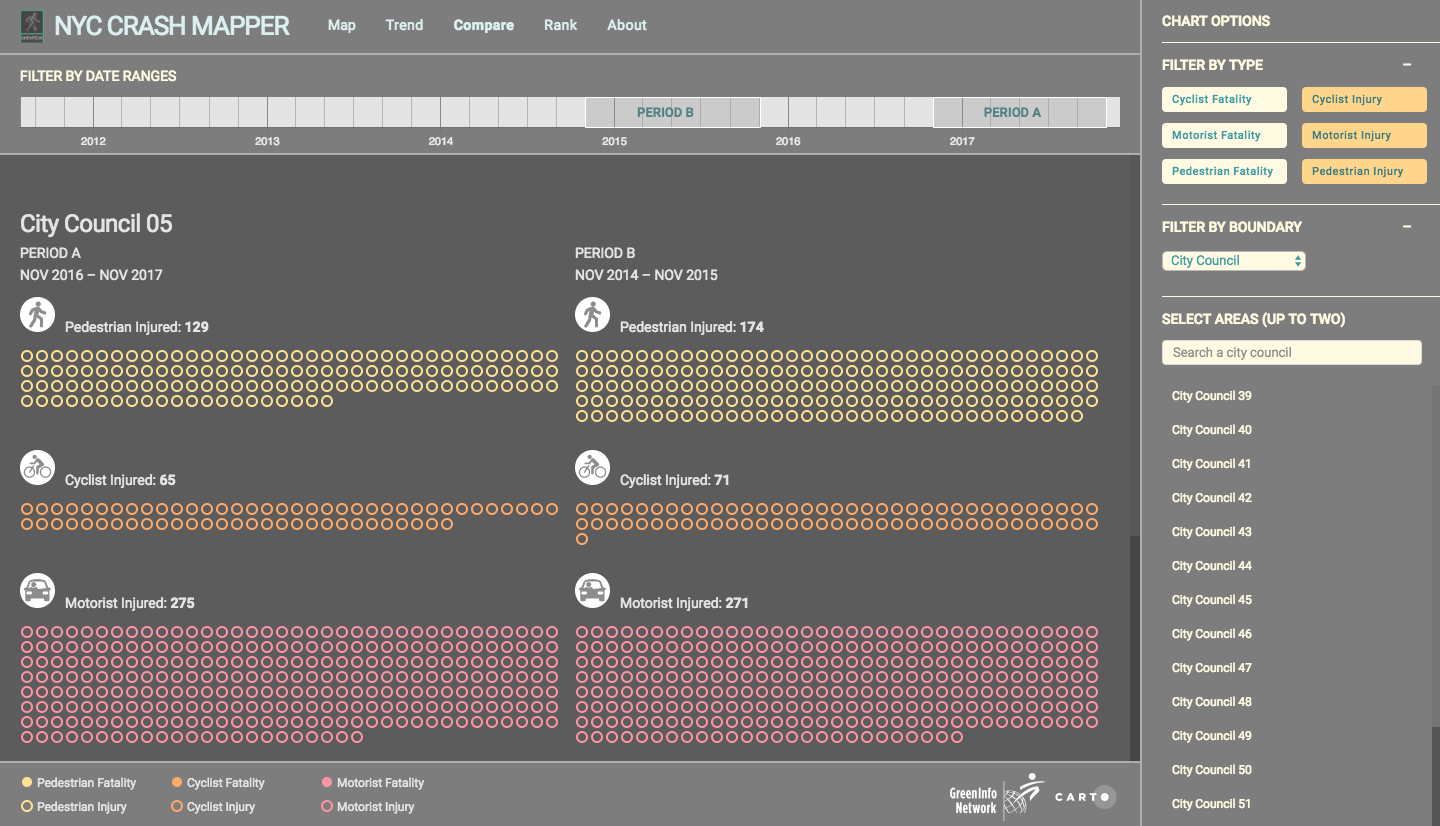
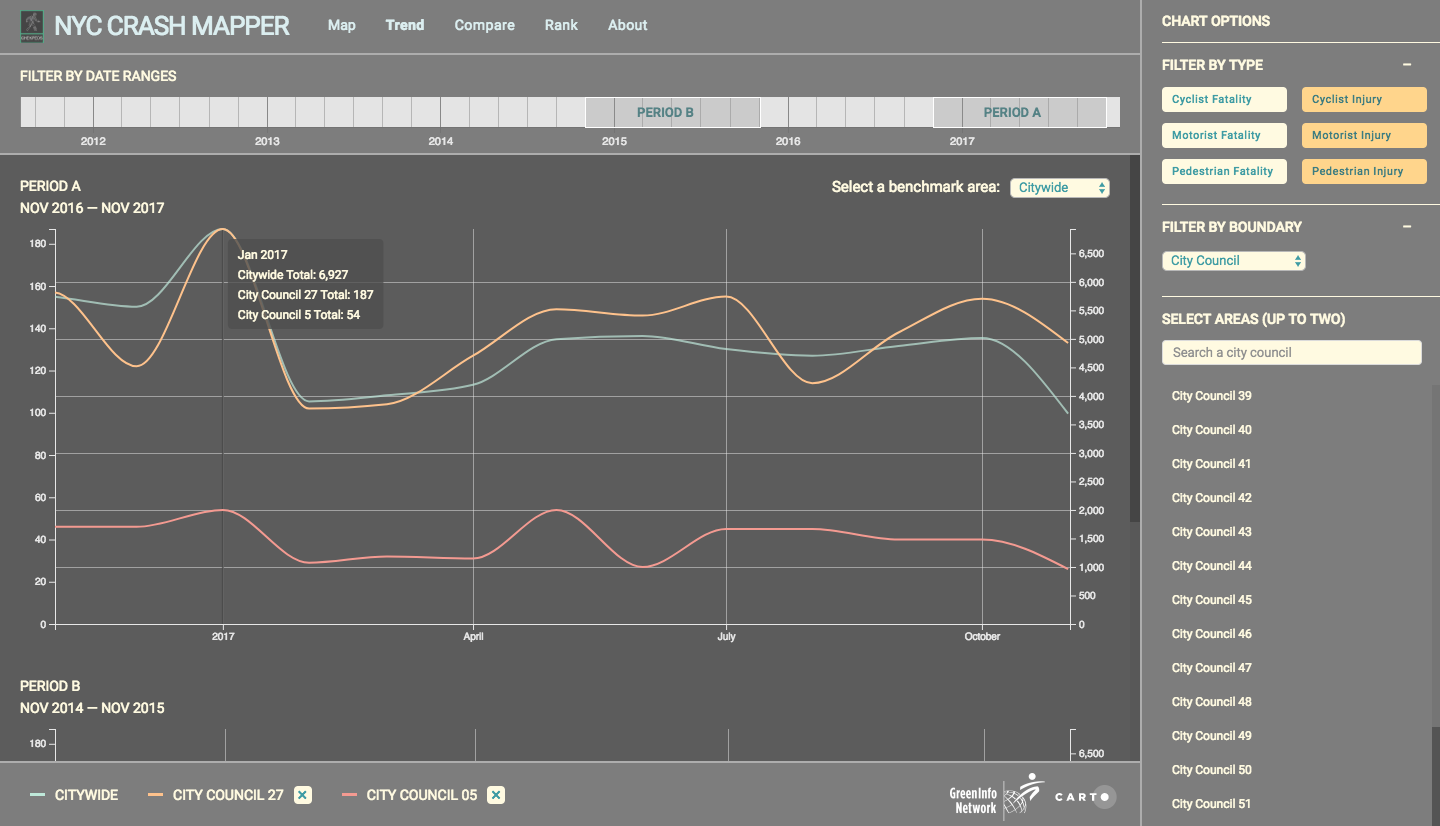
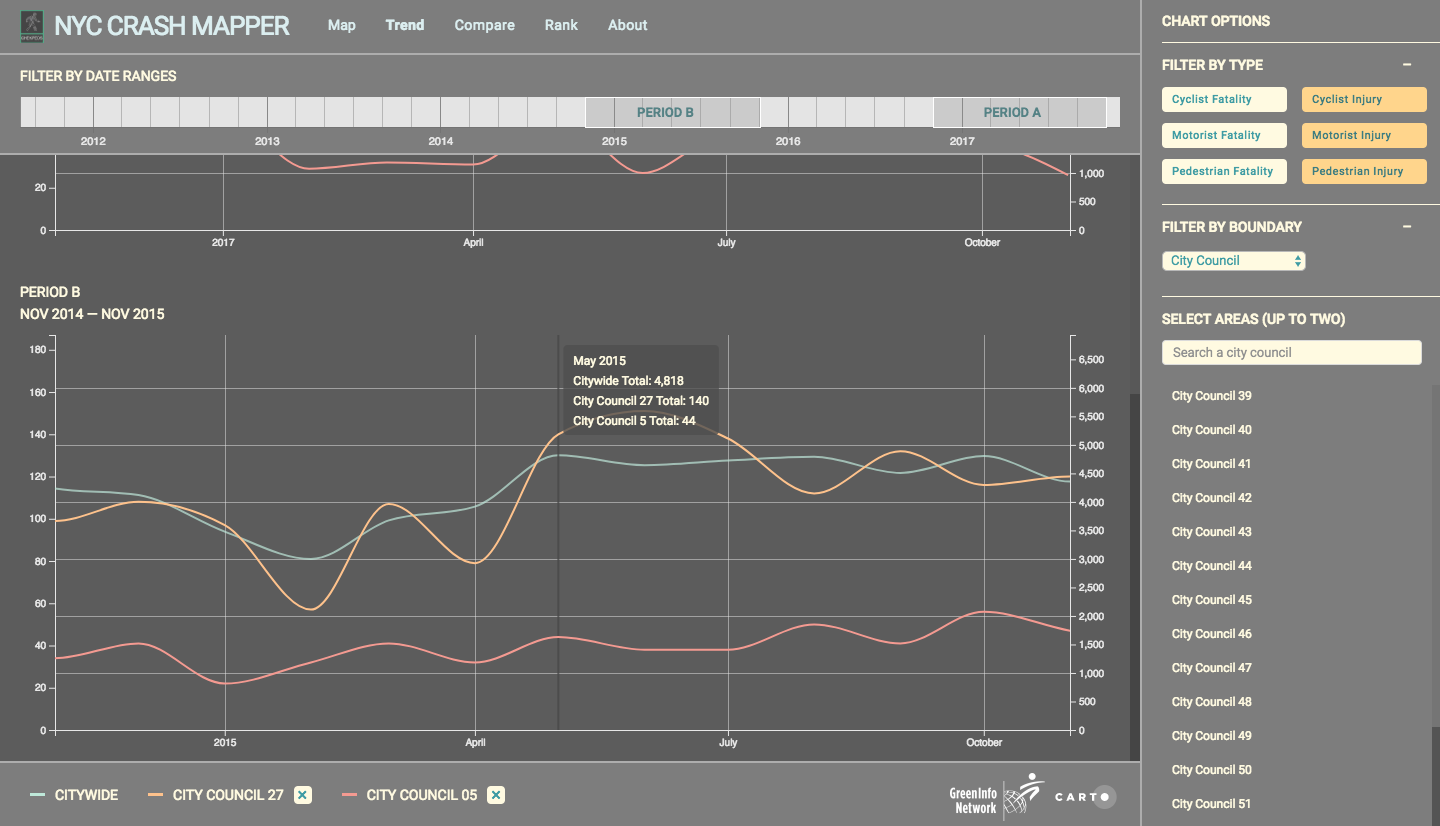
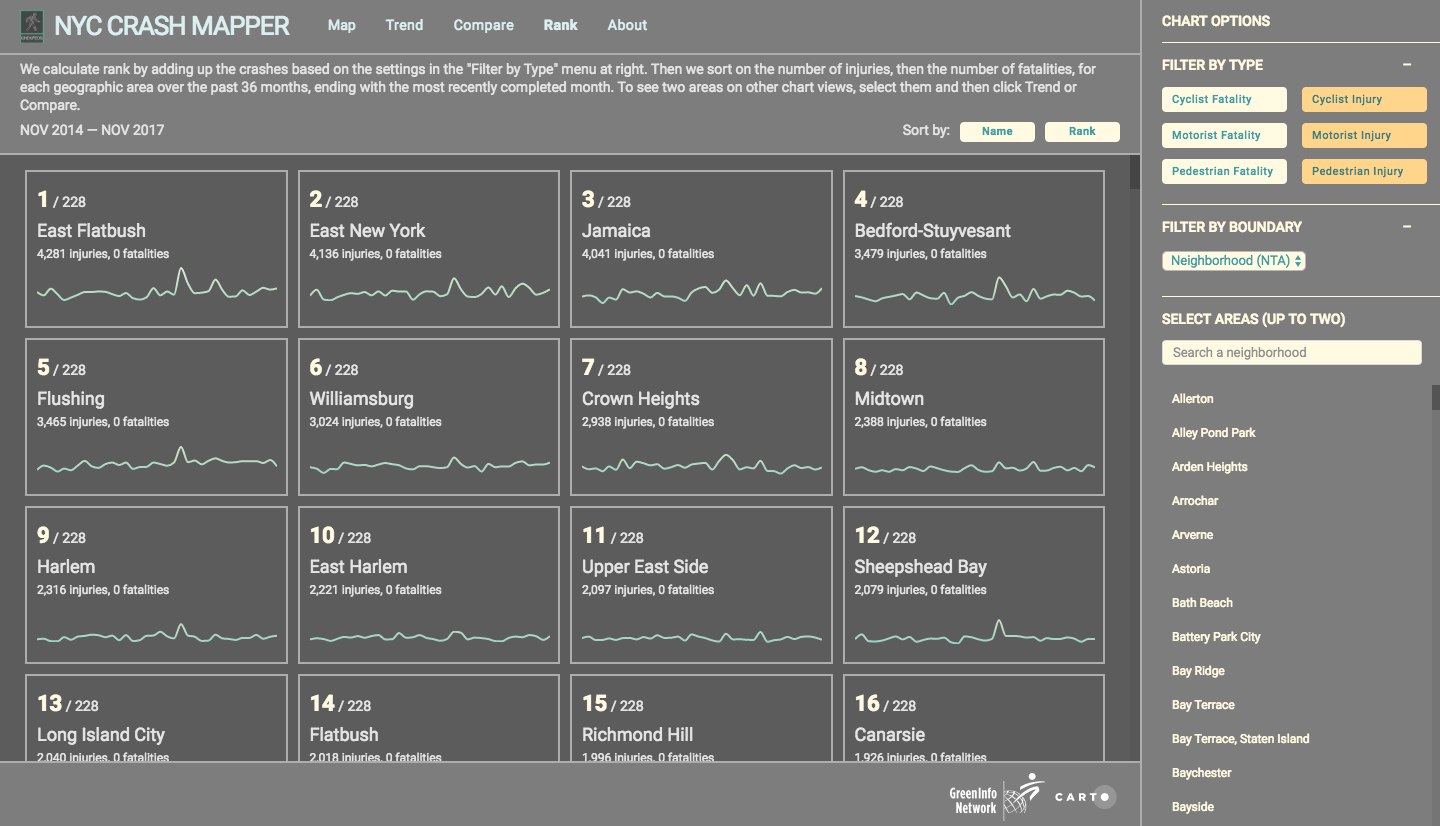
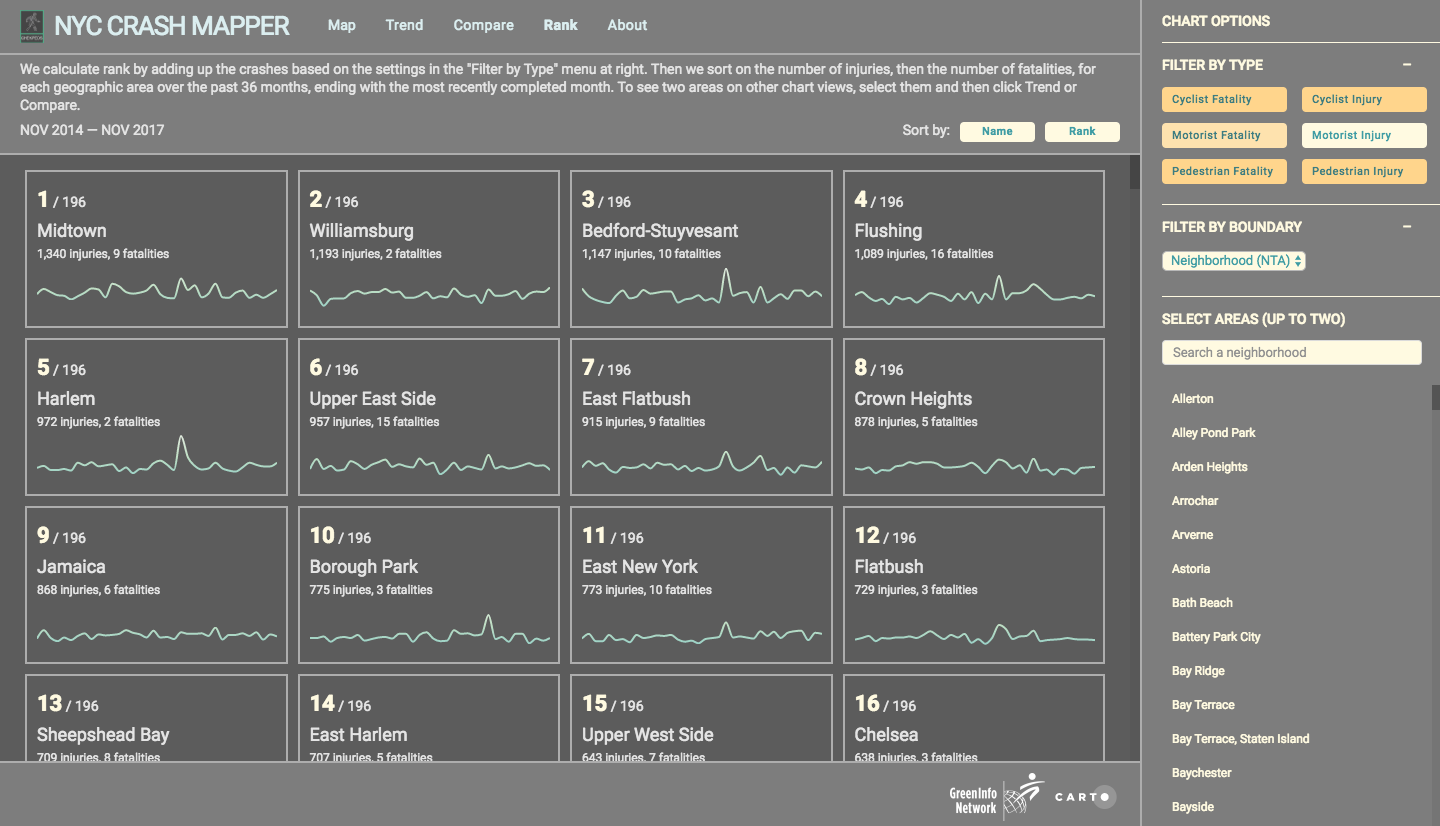
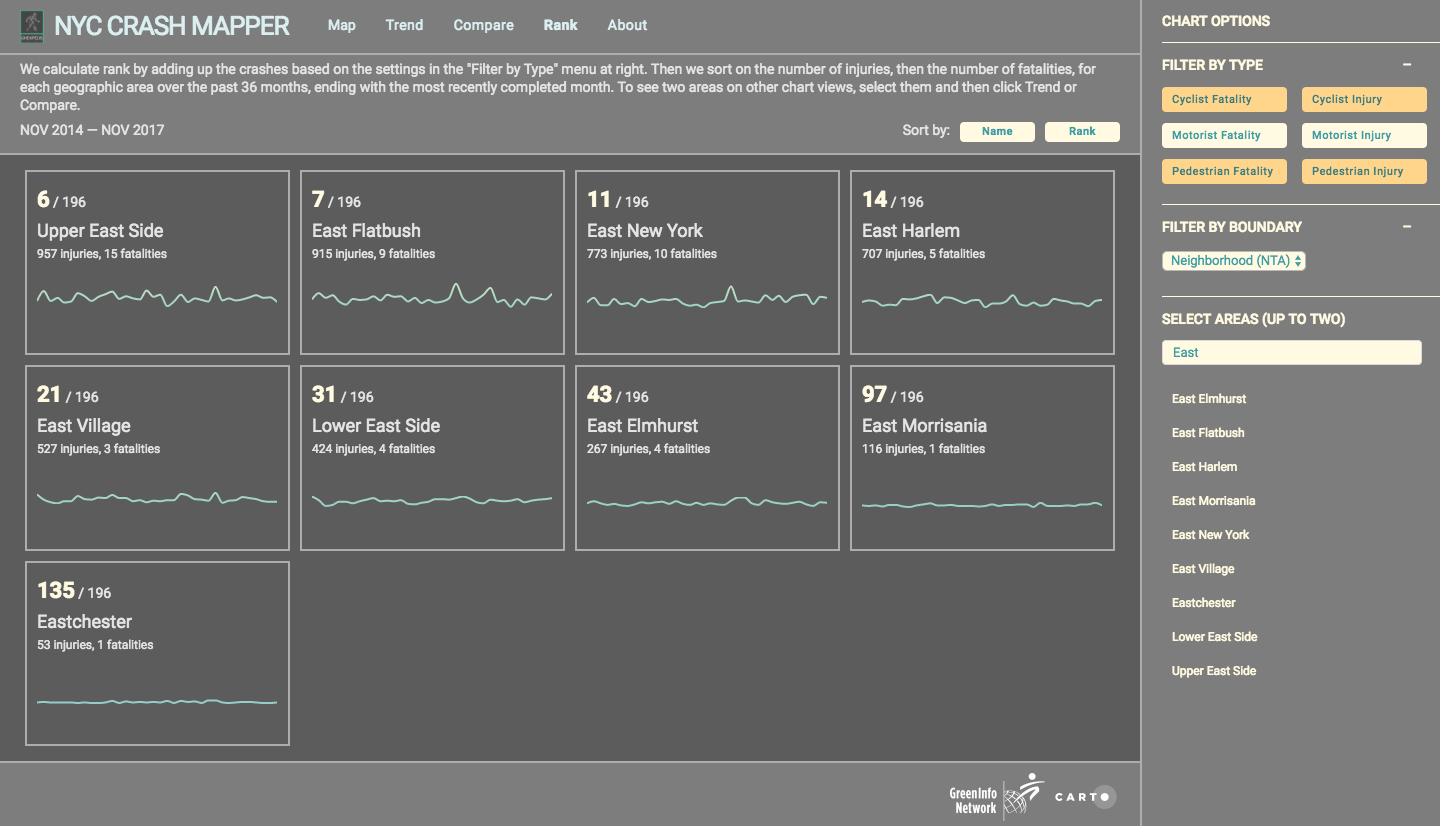
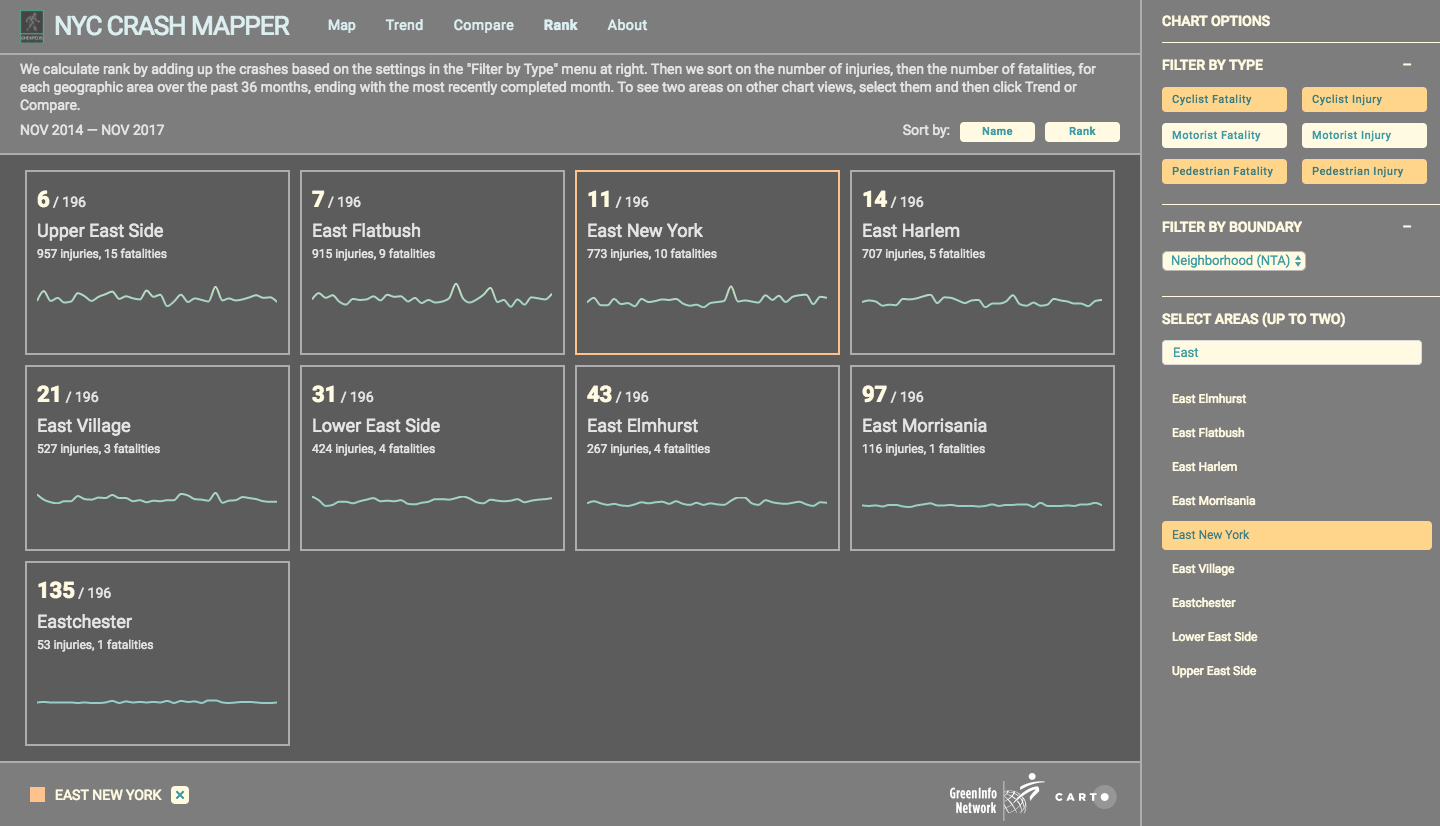
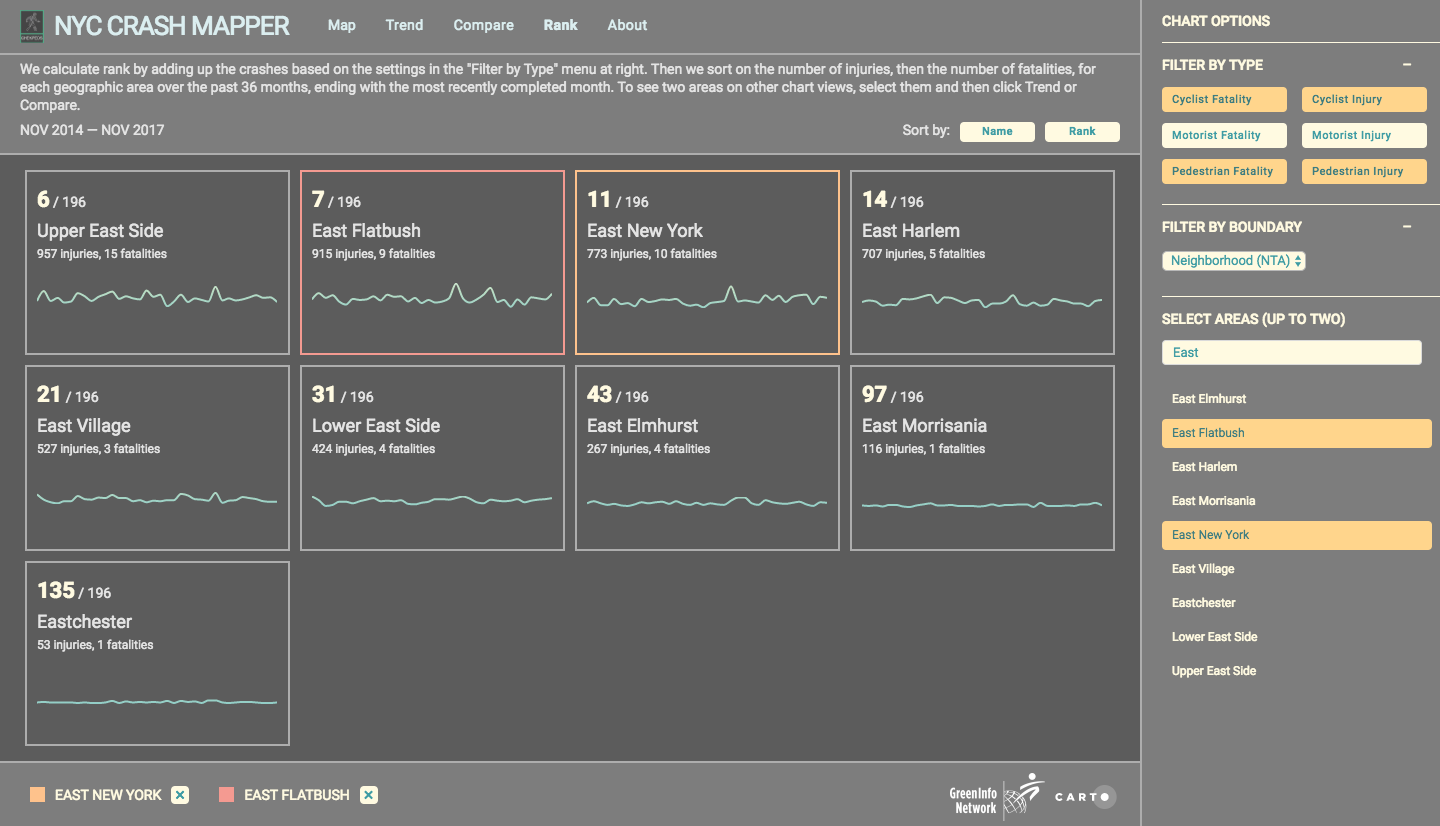
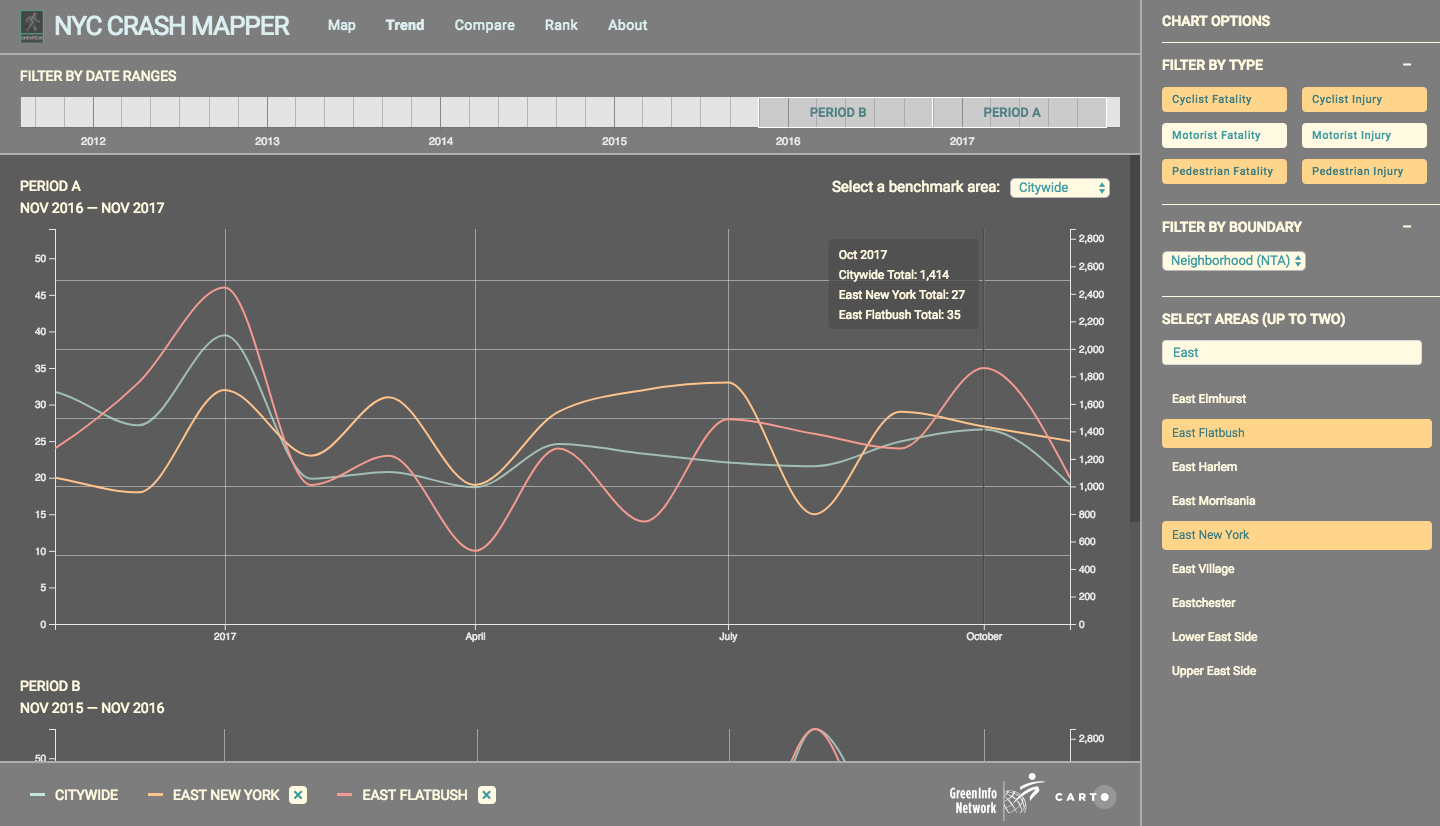
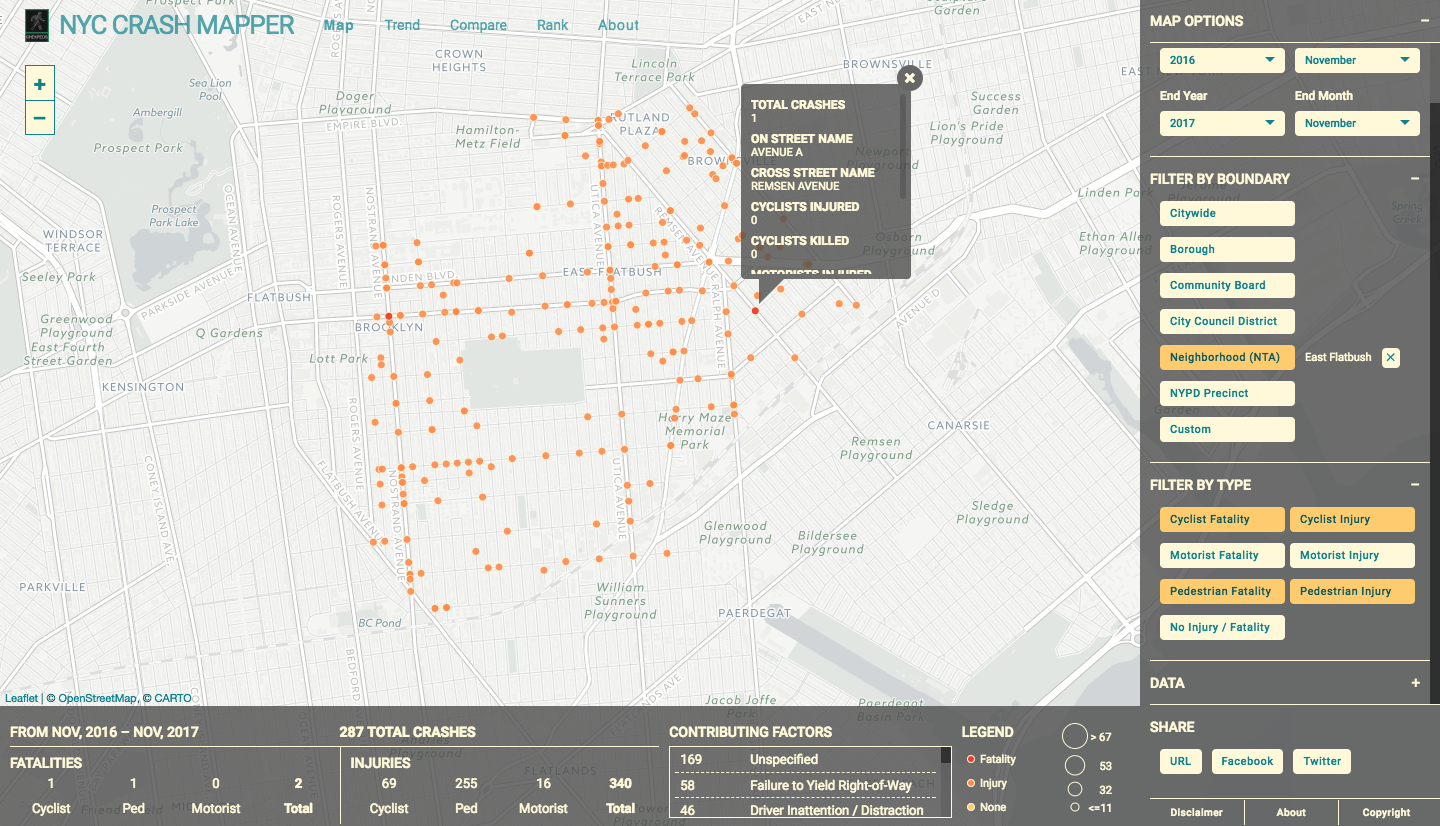
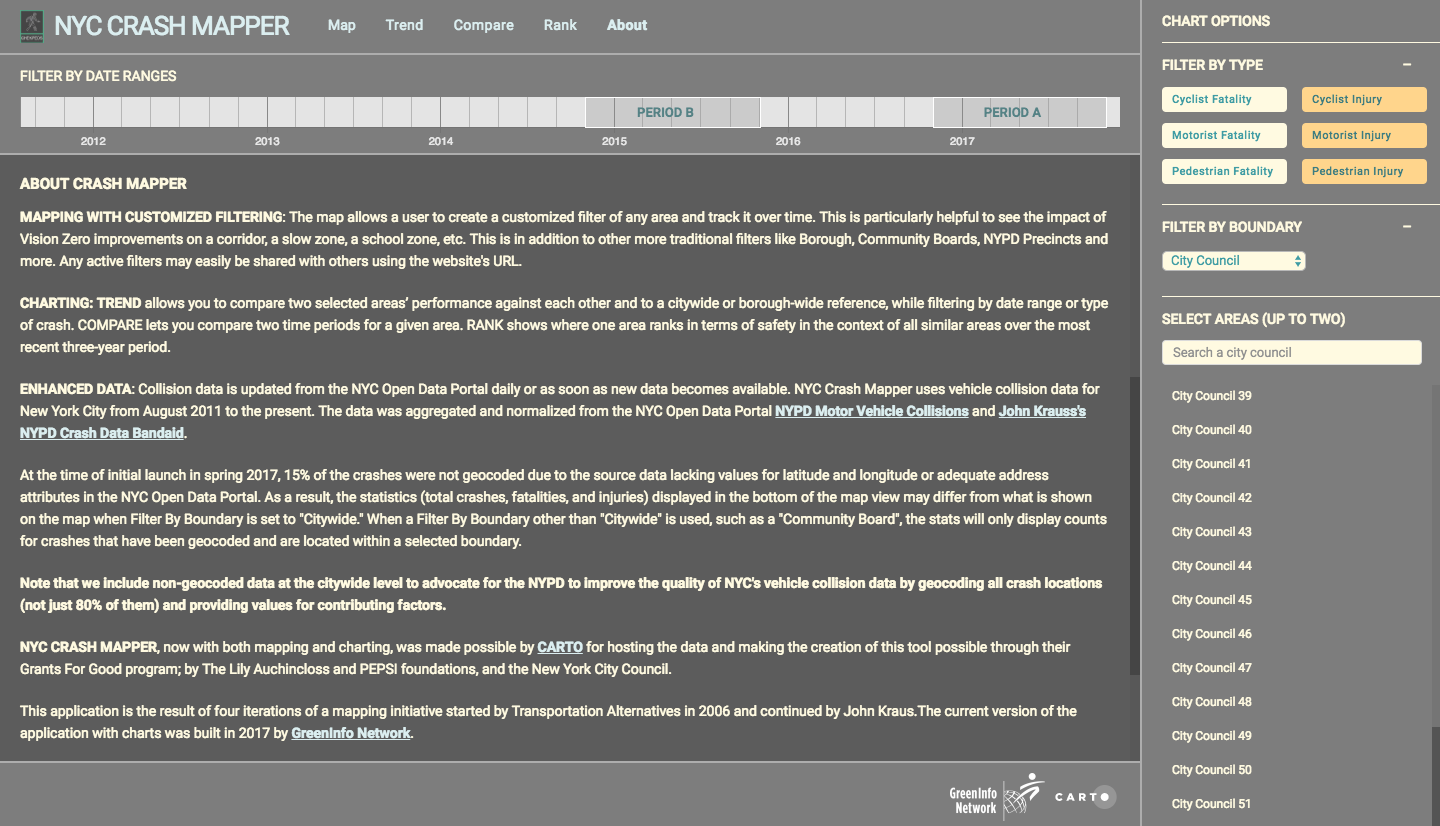
The NYC Crash Mapper Chart View is a data exploration tool that allows users to filter, compare, rank, and view trends in vehicle collision data reported by the NYPD. Trend allows you to compare two selected areas’ performance against each other and to a citywide or borough-wide reference, while filtering by date range or type of crash. Compare lets you compare two time periods for a given area. Rank shows where one area ranks in terms of safety in the context of all similar areas over the most recent three-year period. Map will show the geo location of the crashes using the first area selected, date range of period A, and crash type filters. This was phase two of the original NYC Crash Mapper project. NYC Crash Mapper began as a personal project of mine, then was further developed to include interactive chart components during my tenure at GreenInfo Network. NYC Crash Mapper was featured on the infamous NYC Streets Blog. I gave a talk about the app and the challenges of using open data at the NACIS 2017 annual conference.
Technologies Used: - React - Redux - Leaflet - D3 - Javascript ES6 - CARTO - PostgreSQL - PostGIS - Webpack